
Summary:
Have you ever wondered why most Project Managers are interested in seeing S-curves in project reports?
Do you know what the common uses of S-curves are in projects?
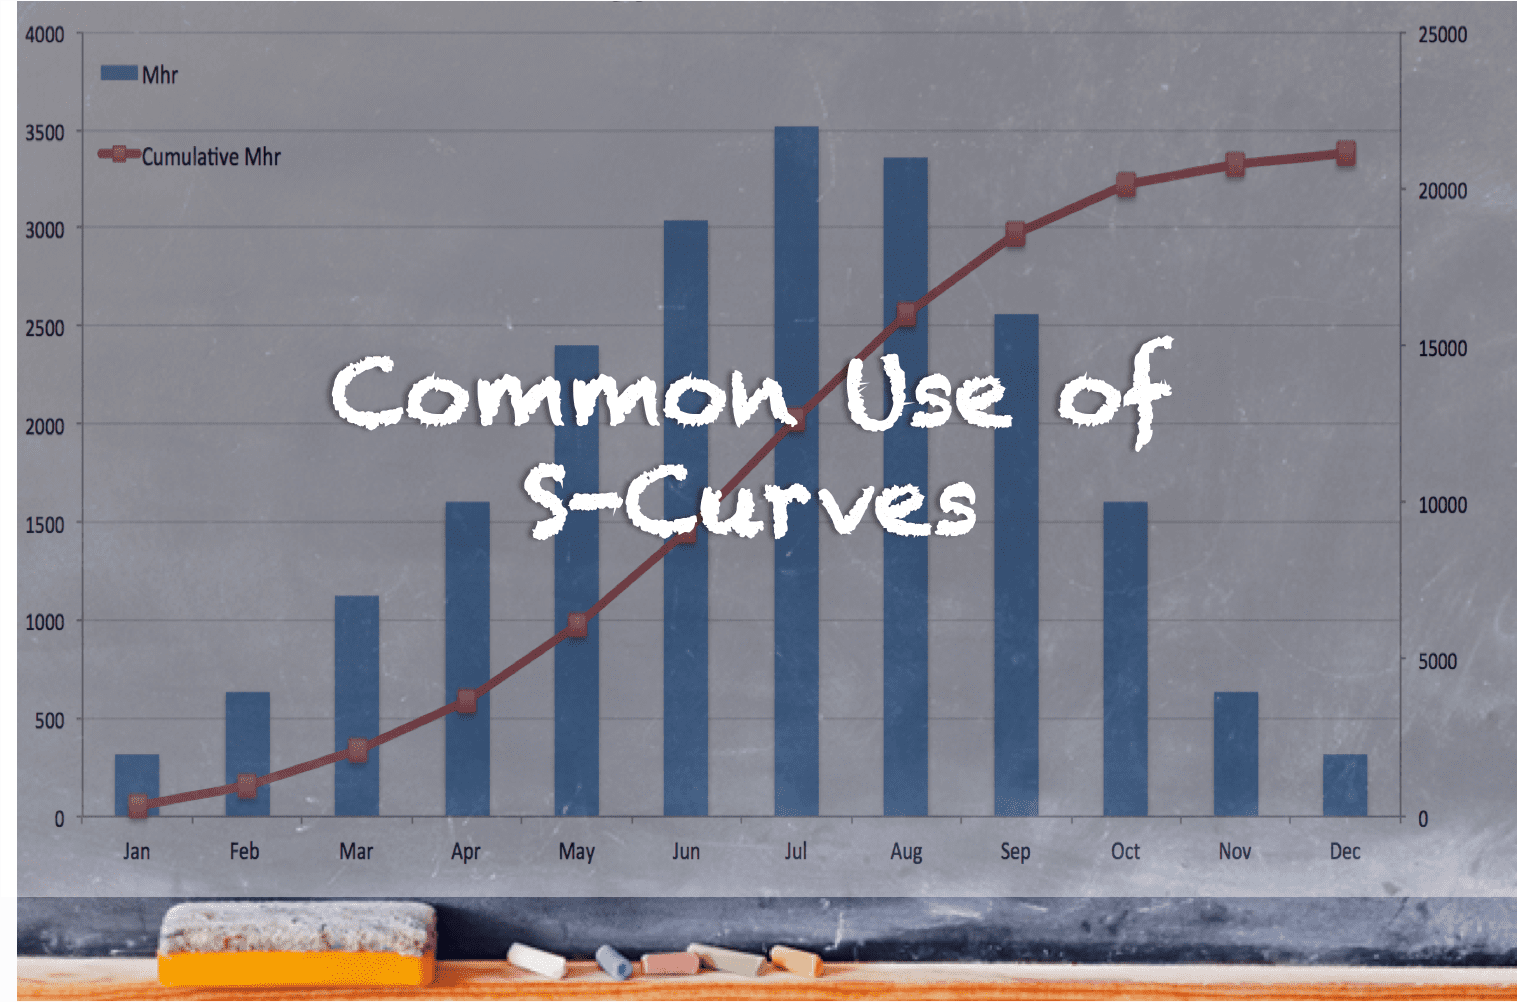
S-curves are great graphical project management tools for planning, monitoring, controlling, analyzing, and forecasting project’s status, progress, & performance. They show the progress of work over time and form a historical record of project trends and variations.
S-curves are used for different purposes. Some of the most common uses of S-curves are for progress and performance evaluation, cash flow forecasts, quantity output comparison, and schedule range of possibilities.
To learn more about the most common uses of S-curves in projects, watch the video below:
Download the free audio mp3 podcast of this episode on iTunes.
Like this episode? Please share it so others can also benefit from it.
Want more training? Subscribe to Project Control Academy to receive complimentary training videos and resources delivered to your mailbox.
Project Control Quotes to Consider: Join Project Control Academy on Instagram for tons of great quotes.
Video Transcript:
Have you ever wondered why most Project Managers are interested in seeing S-curves in project reports?
What are the common uses of S-curves in projects?
In this training, I am going to show you some of the most common uses of s-curves in projects.
I assume that you already know what an s-curves is. If you don’t, make sure that you watch the previous episode of Project Control Mastery on “The philosophy behind S-curves”.
Common Uses of S-curves
S-curves are great graphical project management tools for planning, monitoring, controlling, analyzing, and forecasting project’s status, progress, & performance. They show the progress of work over time and form a historical record of project trends and variations.
S-curves are used for different purposes. Some of the most common uses of S-curves are addressed below:
Progress and Performance Evaluation
One of the most common uses of S-curves is in evaluating project’s progress and performance, especially with the use of Earned Value Management (EVM).
S-curves were generated traditionally within the EVMS process and are the basis for evaluating the project’s progress and performance.
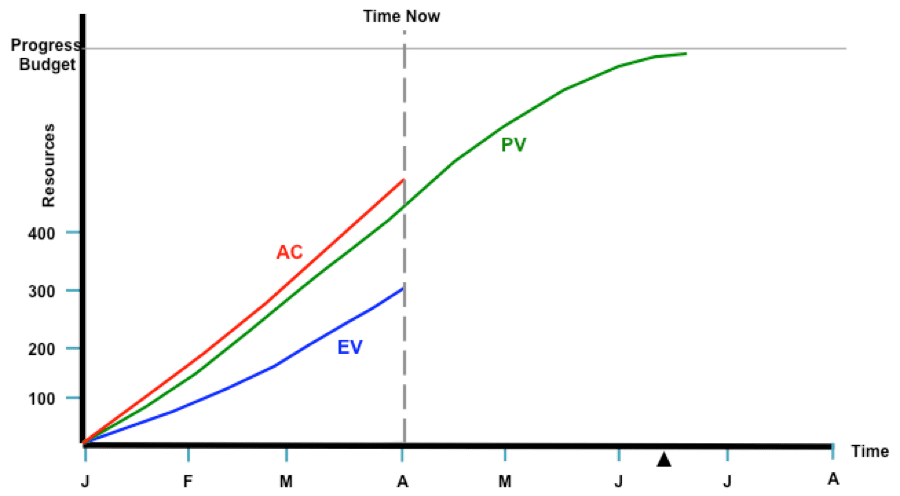
Comparing the planned S-curve, known as Performance Measurement Baseline (PMB) or “Planned Value”, with the “Earned Value” curve and “Actual Cost” curve reveals great information about the project’s current status and future forecasts.
For example, a glance look at the above graph reveals that the project is overrunning its budget and is behind schedule. If you draw the forecast S-curve on the above graph, you will also be able to see the project’s growth & slippage
This simple s-curve quickly reveals any divergence from the baseline plan and allows the progress of a project to be monitored effectively.
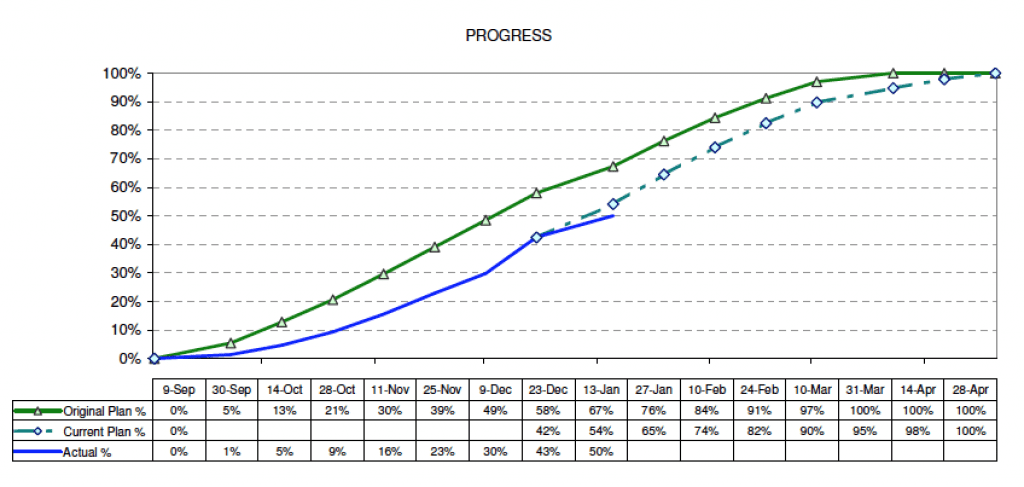
Similar S-curves can be developed for monitoring project’s overall progress. An example is shown below:
Cash Flow Forecasts
Another common use of S-curves is in developing and forecasting Cash Flow curves.
Cash flow is the movement and timing of cash with respect to the events in a project. Drawing a cash flow curve has several benefits for the stakeholders. One of the primary benefits is to evaluate the need for cash and the timing of payment obligations.
An example of a cash flow curve is shown below:
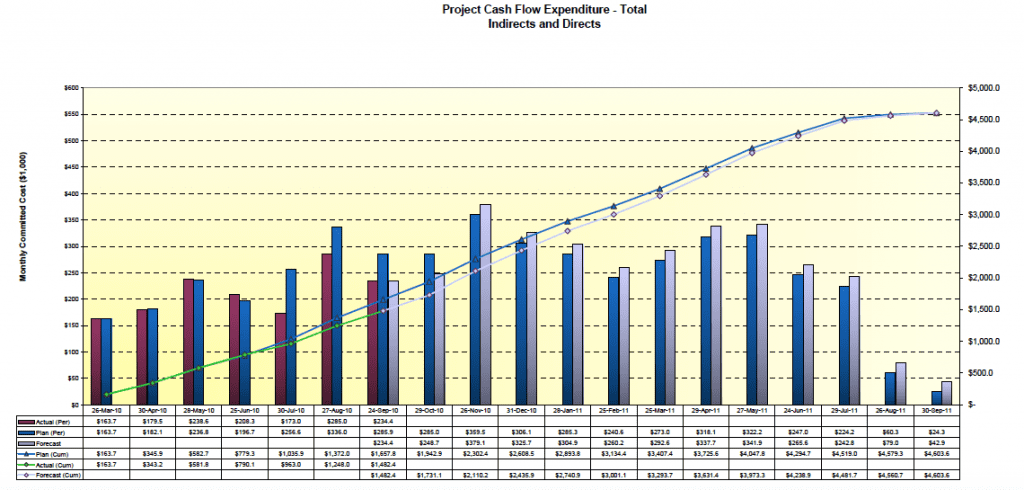
It is important to produce a realistic and useful cash flow curve that accurately depict the timing of each cost element.
Quantity Output Comparison
Another common use of S-curves is the quantity s-curves, which can typically be found in the construction and manufacturing industries.
The planned quantity vs. the scheduled time is plotted and is tracked along with actual quantities. An example of a quantity S-curve is illustrated here:
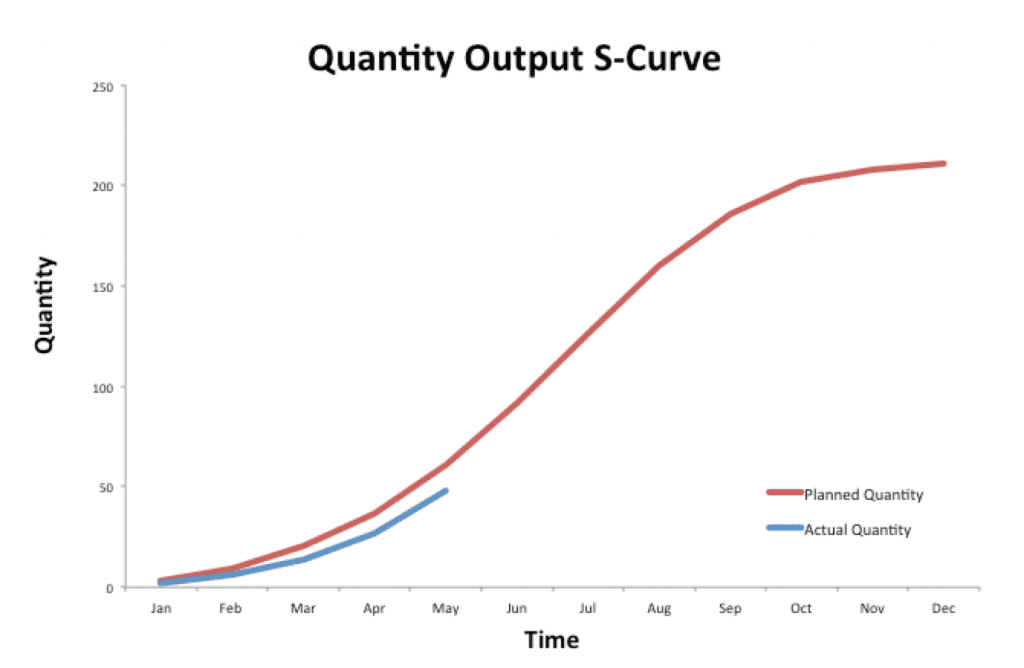
This way, the progress of work by quantities is monitored and any deviation from the baseline plan is quickly revealed.
Schedule Range of Possibilities (Banana Curves)
Most scheduling software can generate S-curves from a resource-loaded schedule according to cost, man-hours, and/or quantity.
The software can provide two types of S-curves; one according to the schedule early dates and another according to schedule late dates. These two S-curves typically overlap at the beginning and end of the project, producing a banana shape curve, known as “Banana Curves”.
The banana shape envelope of the early and late curves represent the range of possibilities that the project can expect if it is to be completed on time.
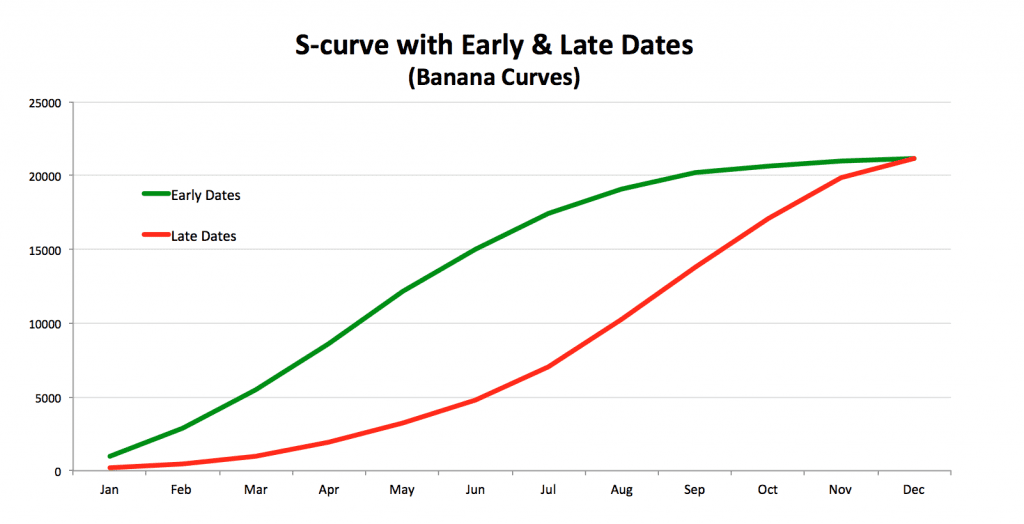
The late curve, which is the lower range of the banana curve, represents the project’s progress if every single activity uses its maximum available float and is performed at its last available date. This means that if any single activity on the late curve slips, the entire project will slip.
Therefore, you should keep an eye on the position of the project’s planned or actual curve. If it gets too close to the late date curve, it may impose a risk of late completion.
About the Author, Shohreh Ghorbani

Shohreh is a licensed project management professional (PMP) recognized by Project Management Institute (PMI) and holds a Master of Science in Industrial Engineering.
Connect with Shohreh via Facebook, Linkedin, Instagram, YouTube



![[Free 90-min Masterclass] How to Avoid Project Delays Turning into Costly Claims](https://www.projectcontrolacademy.com/wp-content/uploads/2025/08/September-2025-Webcast-Chris-Carson-H01-Yellow-2048x1152.jpg.webp)
![[Free 90-min Masterclass] The Ultimate Leadership Recipe for Project Professionals](https://www.projectcontrolacademy.com/wp-content/uploads/2024/08/4-2048x1152.jpg.webp)


