
“Your critical path schedule shows behind schedule. How come your EVM schedule performance indicates an ahead of schedule status?”
“What is wrong with your SPI report?”
“We are going to finish this project 3 months behind the schedule. Tell me why your SPI is showing a good schedule performance?”
Have you ever faced an angry customer or a project manager screaming, “what is wrong with your EVM schedule performance report?” We are late and yet show me good schedule performance? What is going on here?!
Earned Value Management has proven itself to be one of the most efficient performance measurement and feedback tools for managing projects, as outlined in PMI Practice Standard for Earned Value Management
However, EVM implementation and interpretation may cause some difficulties to those who are new to the EVM concept or don’t have a deep understanding and appreciation of EVM.
A gray area in EVM that has created lots of debates and dilemmas is the EVM scheduling metrics; Schedule Performance Index (SPI), and Schedule Variance (SV).
In this training, I would like to make you aware of the issues with the EVM scheduling metrics especially toward the final third of the project, so next time you are faced with an angry client questioning the accuracy of your EVM report, you know how to respond.
Download the free audio mp3 podcast of this episode on iTunes.
Want more training? Subscribe to Project Control Academy to receive complimentary training videos and resources delivered to your mailbox.
Project Control Quotes to Consider: Join Project Control Academy on Instagram for tons of great quotes.
EVM Scheduling Metrics:
EVM uses two primary schedule performance indicators to evaluate the schedule status:
- Schedule Performance Index (SPI)
- Schedule Variance (SV)
To calculate these scheduling metrics, you need to have two key elements in EVM; “Planned Value” & “Earned Value”.
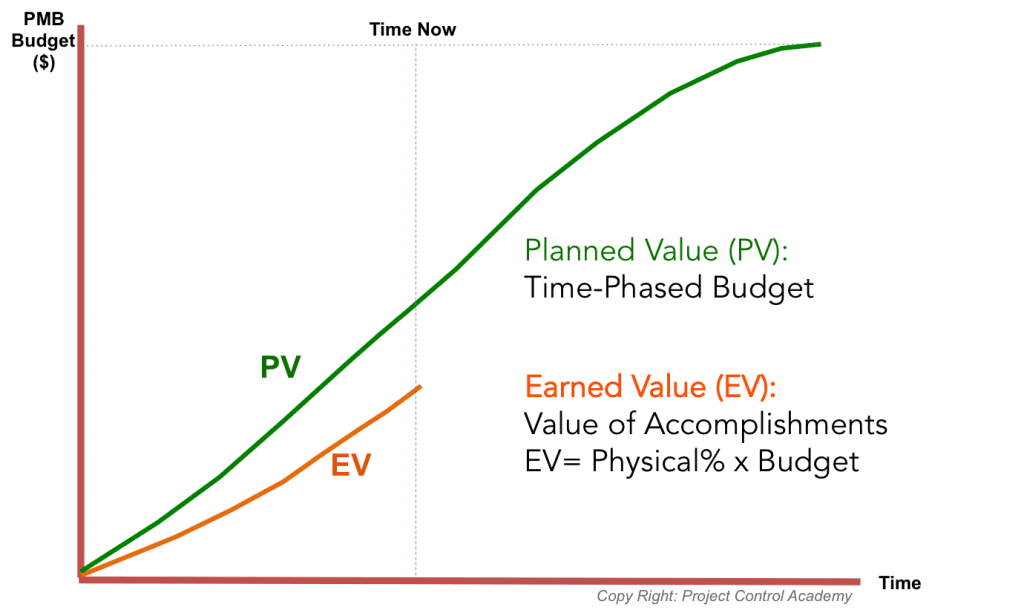
Planned Value (PV):
Planned Value, also known as Performance Measurement Baseline, is the project’s time-phased budget resulted from the project planning effort.
Your total Planned Value should always match your total approved progress-based budget.
Earned Value (EV):
Earned Value is the value of your accomplishments; the value of what has been actually accomplished in the project.
Earned Value is determined as the physical percentage of your budget
EV= % x Budget
Once you have EV and PV, you can determine the SPI and SV.
Schedule Performance Index (SPI)
The Schedule Performance Index (or SPI) is a measure of schedule efficiency.
SPI measures the value of work performed against the work scheduled.
The formula for the Schedule Performance Index is “Earned Value” divided by “Planned Value.”
SPI= EV/PV
Schedule Variance (SV)
The schedule variance (SV) determines whether a project is ahead of or behind schedule in accomplishing work.
The Schedule Variance is the difference between the “Earned Value” and the “Planned Value”.
SV= EV-PV
To better understand these metrics, let’s walk through a simple example:

In this example, Earned Value is $300, and the Planned Value is $430. What is the Schedule Performance Index (SPI)?
SPI= EV/PV= $300/$430 = 0.7
The SPI of 0.7 indicates that work is being accomplished at 70% of its planned rate. In another word, on average for every 8 hours per day working on the project, only 5 hours and 35 minutes worth of the planned work is being performed.
How about the Schedule Variance (SV)?
SV= EV-PV= $300-$430= -$130 (SV<0)
What SPI or SV Indicate
As illustrated in the previous example,
- If SPI<1 (or SV<0), less work is completed than planned (“Behind” schedule)
- If SPI>1 (or SV>0), more work is completed than planned (“Ahead” of schedule)
- If SPI=1 (or SV=0), the project is “on schedule”
The ahead or behind schedule interpretation of the EVM scheduling metrics comes with a big warning!
SPI/SV Warning
Please be advised that an unfavorable SPI or SV does not necessarily mean a schedule slippage. On the other hand, a favorable SPI or SV does not necessarily indicate an ahead of schedule status.
Schedule variance is very often misinterpreted as a time-based indicator, for example, are we early or late and by how much?
SV & SPI are not time-based indicators, but rather an indication of the physical status (how much of the work has been accomplished).
EVM Scheduling metrics show whether less or more work has been accomplished than planned.
What SPI shows is the dollar value of the work completed for every dollar of work scheduled. For example, an SPI of 0.95 means that for every dollar of work scheduled for completion, only 95 cents worth of work was actually completed.
Remember, EVM measures the schedule performance not in units of time, but rather in cost.
Do you remember the example brought earlier? The schedule variance (SV) was -$130.
The point is that SPI & SV are independent of the Critical Path Schedule.
A schedule slippage can only be determined by evaluating the critical path network.
Another issue with the EVM scheduling indicators happens toward the end of the project.
SPI & SV are not very reliable metrics in assessing the schedule status of the project toward the end of the project.
I know you might be thinking “why”??… What is happening toward the end of the project that makes the EVM scheduling metrics unreliable?!
To show you the reason why let’s do a quick trend analysis on SPI:
This is an example of a project that is behind the schedule, according to EVM scheduling metrics (EV<PV):

If you draw the SPI curve over time, how would it look like?
Well, Earned Value is less than the Planned Value, therefore the Schedule Variance is negative and SPI is less than one. With this performance, the schedule slippage is also predicted.
Therefore, if you plot SPI from the beginning of the project up to now, it will look something like this graph:

What is your opinion about the SPI graph from “time now” until the end of the project?
Would it further decline or improve?
How about the SPI at the end of the project?
To answer this question, let’s first examine what SPI will be at the end of the project.
SPI= EV/PV
EV= % x Budget at Completion
At the end of the project,
Progress is 100%, therefore;
EV= 100%x BAC= BAC
Your total Planned Value should always match your total approved progress-based budget. Therefore, at the end of the project,
PV= BAC
As a result, at the end of the project,
EV= PV= BAC
SV= 0
SPI=1
Therefore, at some point in time, all SPI curves will level off, then make their way back up to ultimately touch the one line when the actualized work has been completed.
Although the project may be late compared to the original baseline plan, at project completion there will be no schedule variances!
Now the question is whether the increase in SPI toward the end of the project is an indication of project schedule improvement or a false indication?
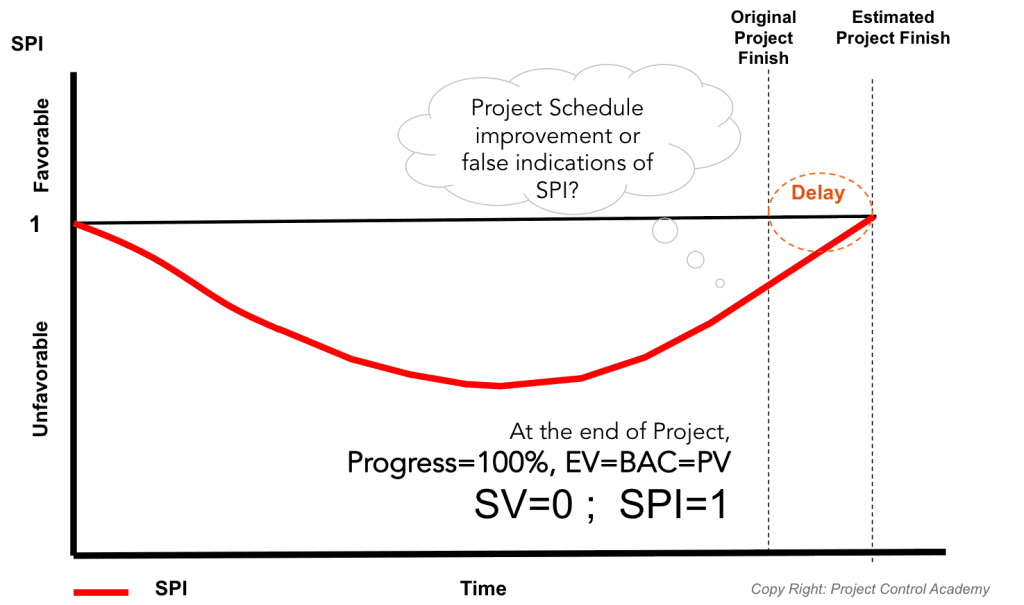
Schedule Performance at completion is ONE by definition, even if the project is completed late!
Now, are you convinced why the EVM scheduling metrics are not reliable especially toward the 2/3rd of the project?
As stated by a report from the Department of Defense, “an SPI or Schedule Variance is stated in terms of dollars of work and must be analyzed in conjunction with other schedule information.”
The EVM Schedule Variance simply reflects a variance from the approved baseline. It is sometimes misleading to look at an earned value schedule position alone and rely on it to provide the project’s schedule position.
Being ahead or behind schedule often depends on where each task was placed on the baseline. Likely, most baselines reflect simply a best guess, perhaps the most likely position for each task. The time placement of each task may have little relationship to the project’s critical path. Critical path assessment complements the true schedule position.
That is the reason why a schedule variance analysis needs to be performed to complement the result of the EVM schedule variance and performance metrics.
Therefore, don’t rely solely on EVM scheduling metrics to assess the project schedule status.
Always analyze the EVM scheduling metrics in conjunction with the critical path schedule analysis.
Now you might question, should I ignore the EVM scheduling metrics if they are not reliable?
No. Until the 2/3rd of the project, those metrics are still reliable. However, you have to use them with caution.
You need to analyze your EVM scheduling metrics alongside your CPM schedule. By doing so, the EVM scheduling metrics reveal great information about your project, especially if the EVM scheduling indicators and your CPM schedule are contradicting. For example, your SPI shows ahead of schedule (SPI>1) while your CPM schedule shows a behind schedule status. When you dig down into your schedule, you will realize something is causing that issue.
The EVM scheduling metrics provide a good warning signal that raises a flag for deeper analysis.
I hope this training clarified some of the issues you might have faced with applying the EVM scheduling metrics in your projects.
Now the question is:
How can I justify the quirky behavior of SPI & SV, especially toward the end of my project?
Is there any solution besides analyzing the critical path schedule?
There are several methods that you can apply to improve the accuracy and reliability of your EVM scheduling metrics.
One of the newly merged techniques is the application of “Earned Schedule”.
The Earned Schedule concept has been considered as an improvement/extension to the EVM practice.
The Earned Schedule concept has been added as an appendix to the PMI Practice Standard for Earned Value Management in 2011. However, it was initiated in 2003.
If you are interested in learning more about the Earned Schedule, please check the next episode of Project Control Mastery, where I show you the concept of the Earned Schedule and how you can apply it in your projects.
How did you justify your EVM scheduling metrics in your projects? I’d be interested in hearing your thoughts and comments that would promote a healthy and positive discussion.
About the Author, Shohreh Ghorbani

Shohreh is a licensed project management professional (PMP) recognized by Project Management Institute (PMI) and holds a Master of Science in Industrial Engineering.
Connect with Shohreh via Facebook, LinkedIn, Instagram, YouTube


![[Free 90-min Masterclass] How to Avoid Project Delays Turning into Costly Claims](https://www.projectcontrolacademy.com/wp-content/uploads/2025/08/September-2025-Webcast-Chris-Carson-H01-Yellow-2048x1152.jpg.webp)
![[Free 90-min Masterclass] The Ultimate Leadership Recipe for Project Professionals](https://www.projectcontrolacademy.com/wp-content/uploads/2024/08/4-2048x1152.jpg.webp)


