Summary:
Have you ever wondered what an s-curve is in projects?
Do you know why Project Managers are interested in seeing s-curves in project reports?
Well, an s-curve is a project management graphical tool that displays cumulative data ( e.g. project’s costs, hours, progress, or quantities) against time.
The term S-Curve denotes the tendency of the cumulative curve to form a shallow ‘S’ shape; flatter at the start, steeper in the middle, and flattening off again towards the end.
Although the s-curve drives from the S-like shape of the curve, don’t be surprised if your s-curve is not in the shape of an “S”. The shape of an s-curve depends on the nature of your project.
Watch this video to learn more about the philosophy behind s-curves and get crystal clear on the concept of s-curves.
Download the free audio mp3 podcast of this episode on iTunes.
Like this episode? Please share it so others can also benefit from it.
Want more training? Subscribe to Project Control Academy to receive complimentary training videos and resources delivered to your mailbox.
Project Control Quotes to Consider: Join Project Control Academy on Instagram for tons of great quotes.
Video Transcript:
S-curve! Hum, what on earth is an s-curve?!
Is it a curve with the shape of “S”? …… What kind of curve is an s-curve anyway?
Why are Project Managers interested in seeing s-curves in reports? Tell me, what is the use of an s-curve?
These were my questions when I first got exposed to the term “s-curve” in projects. I didn’t know what an s-curve was until I started populating s-curves in almost every single project cost or schedule report that I issued. I realized how this simple graphical report is useful in briefing the stakeholders on project status and trends in a quick and intuitive manner.
In this training, I am going to open up the concept of s-curves for you, so you are crystal clear on the philosophy behind s-curves and their use.
What is an s-curve?
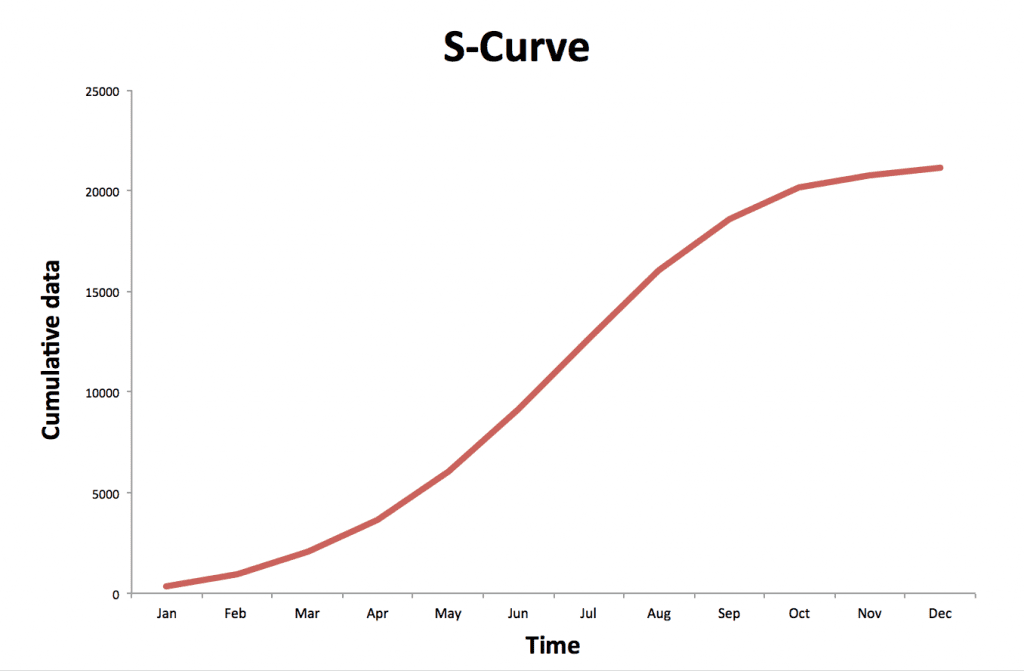
An s-curve is a graphical display of cumulative man-hours, cost, progress, or other quantities plotted against time.
An s-curve aims to represent the utilization of resources over the proposed time of the project.
S-curves are also called, “s-plots”, “cumulative distribution charts”, “velocity diagrams”, and “Performance Measurement Baseline (PMB).”
The shape of the s-curve reveals information about the project
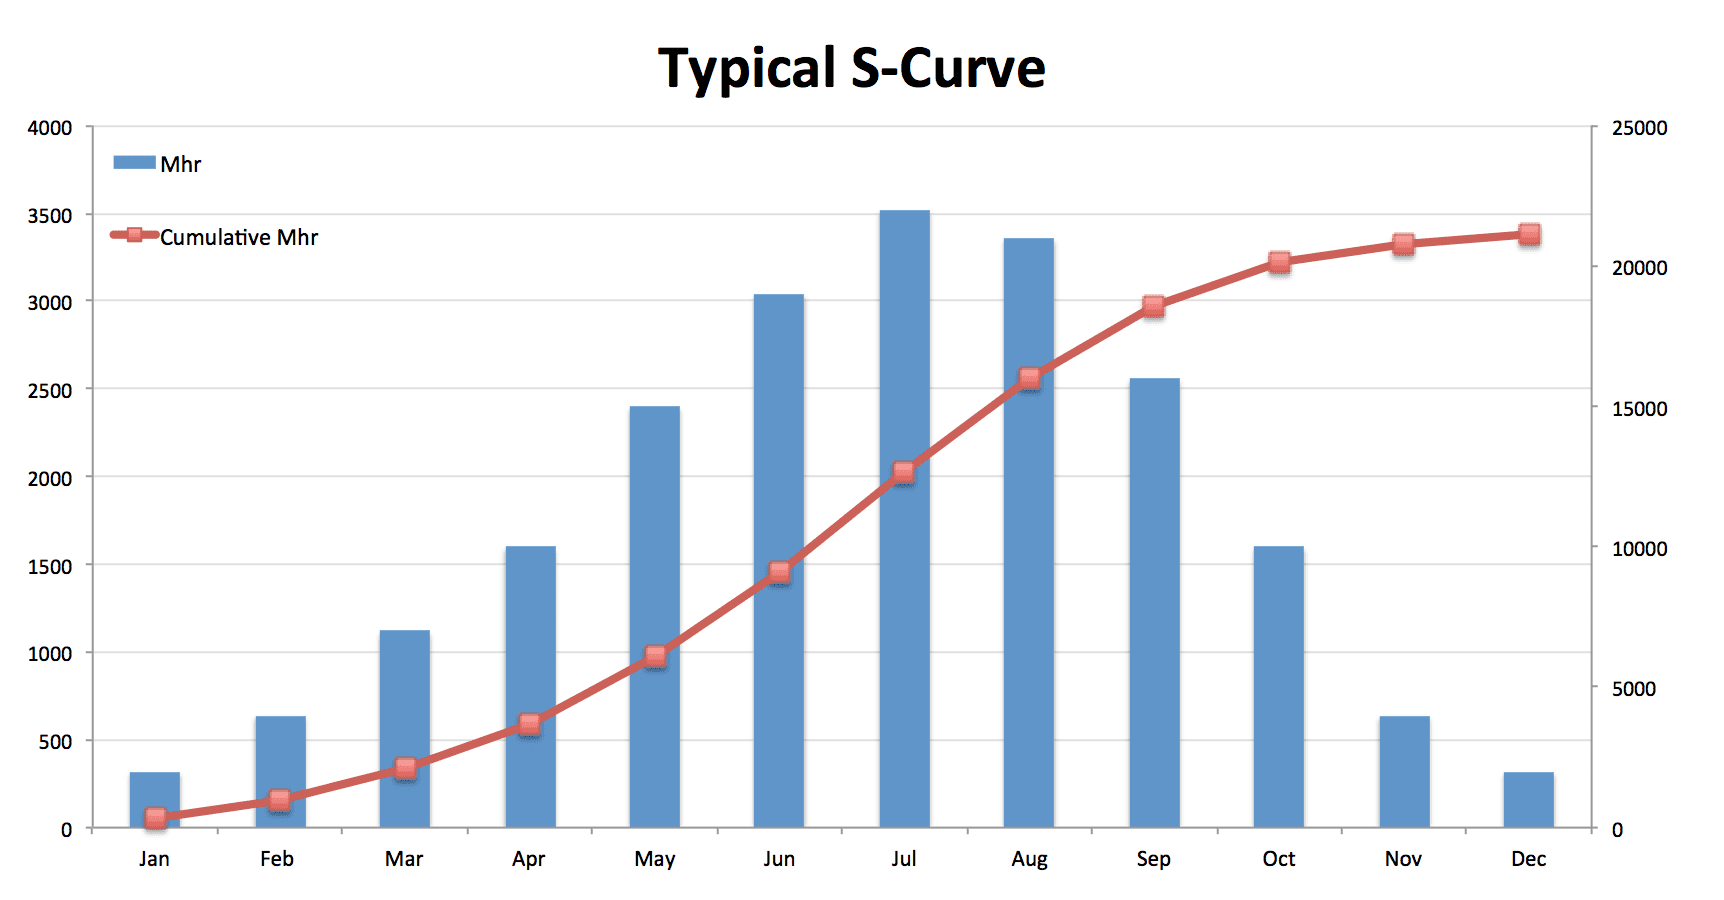
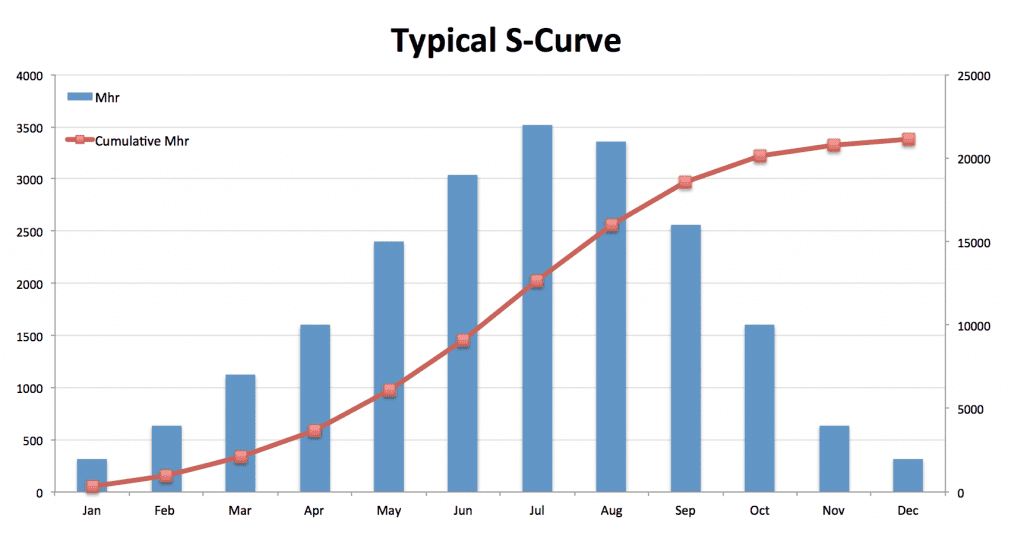
The term S-Curve denotes the tendency of the cumulative curve to form a shallow ‘S’ shape; flatter at the start, steeper in the middle, and flattening off again towards the end.
This shape is typical for most projects as they start slowly, ramp up during the main execution phase, and then wind down again towards the project’s completion, as productivity declines and work runs out.
Although the s-curve drives from the S-like shape of the curve, don’t be surprised if your s-curve is not in the shape of an “S”. The shape of an s-curve depends on the nature of your project:
Front-Loaded S-Curves
You may find a front-loaded s-curve, where the curve starts up steeply and then flatten out.
The graph below illustrates how a front loaded s-curve may look like:
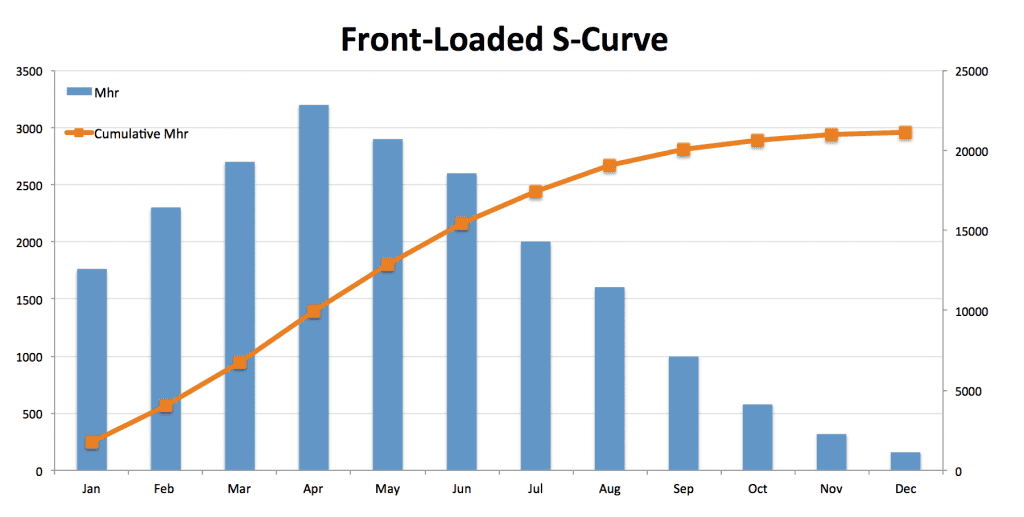
As demonstrated here, front loaded curves have a rapid start. More resources assumed to be consumed early in the project. This may happen for repetitive projects that need little planning and preparation time. Other examples of front loaded curves are for projects that have been accelerated from the beginning, or projects that need urgent repair of damage early on. Mobilization costs and deposits will also lean toward a front-loading s-curve.
The questions that need to be asked on front loaded curves are what the basis for this plan is and whether the resources are available.
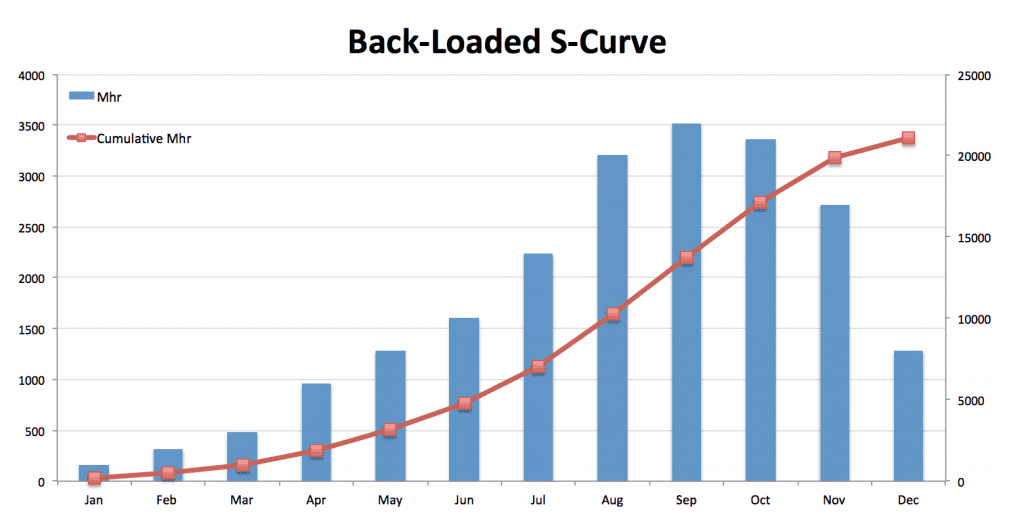
Back-Loaded S-Curves
Curves that start out with a lower slope and increasingly steep towards the end of the project are typically back-loaded.
In the back-loaded curves, most resources assumed to be consumed late in the project.
A back loaded s-curve could indicate a large planning or design in the beginning and a reduced construction time.
Here is an example of a back-loaded project:
To give you a perspective of a front-loaded and back-loaded s-curve vs. a typical s-curve, I have put all three curves in one graph:
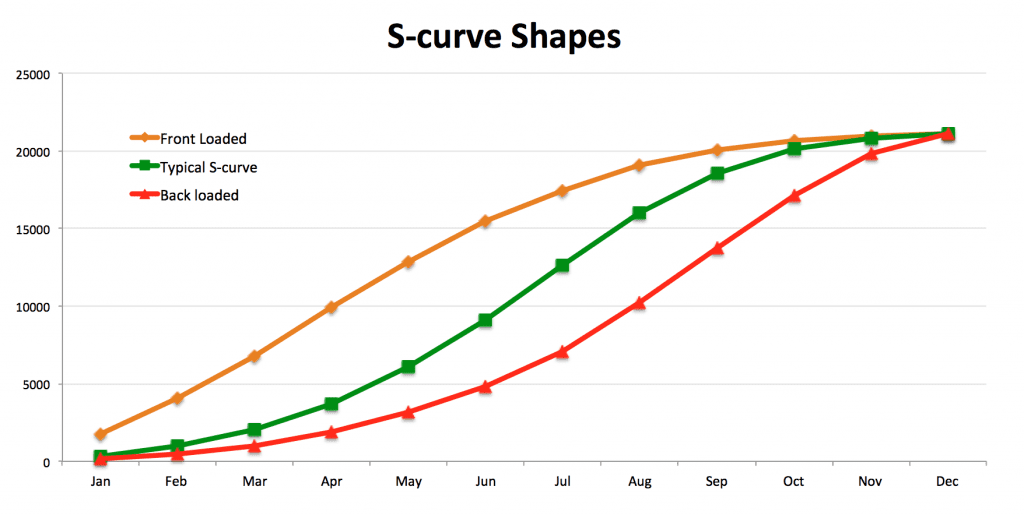
You need to be careful with either front-loaded or back-loaded curves. You should verify the basis of the project plan and ensure both the schedule and the available resources are realistic.
With the understanding of s-curves and their various shapes, now the question is “what kind of information are plotted in an s-curve?”
Well, the x-axis is “time”. The time unit should coincide with the project status update intervals (e.g. monthly, bi-weekly, or even weekly). The smaller the time unit, the “smoother” the s-curve will be and easier to use for analyzing trends.
The y-axis of an s-curve varies according to the information that you like to plot. It might be the cost ($), man-hours (Mhrs), manpower (FTE), progress (%), quantities, resources, etc.
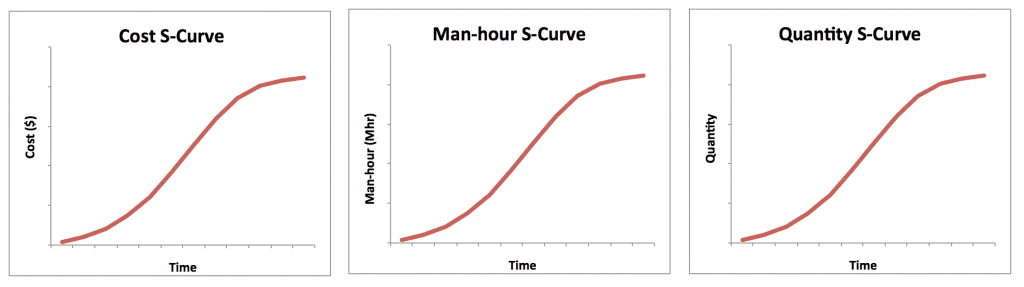
Common Types of S-curves
The most common types of S-curves are man-hours vs. time and cost vs. time. The cost vs. time S-curves are useful for developing project’s overall “cash flow”.
Another common type of S-curves is the ones generated using units/quantities vs. time. These kinds of s-curves are useful for comparison.
Now, are you clear on the philosophy behind S-curves, their shapes, and types?
Going back to the question I asked earlier, “Why Project Managers are interested in seeing s-curves in reports?”, do you know what the use of s-curves is? Do you know who the developer of s-curves is in a project? And how s-curves are developed?
This will be the topic of my next post in this series, “The Common Use & Utilization of S-curves in Projects”.
In Summary:
An s-curve is a project management graphical tool that displays cumulative data ( e.g. project’s costs, hours, progress, or quantities) against time.
The term S-Curve denotes the tendency of the cumulative curve to form a shallow ‘S’ shape; flatter at the start, steeper in the middle, and flattening off again towards the end.
Although the s-curve drives from the S-like shape of the curve, don’t be surprised if your s-curve is not in the shape of an “S”. The shape of an s-curve depends on the nature of your project.
About the Author, Shohreh Ghorbani

Shohreh is a licensed project management professional (PMP) recognized by Project Management Institute (PMI) and holds a Master of Science in Industrial Engineering.
Connect with Shohreh via Facebook, Linkedin, Instagram, YouTube


![[Free 90-min Masterclass] How to Avoid Project Delays Turning into Costly Claims](https://www.projectcontrolacademy.com/wp-content/uploads/2025/08/September-2025-Webcast-Chris-Carson-H01-Yellow-2048x1152.jpg.webp)
![[Free 90-min Masterclass] The Ultimate Leadership Recipe for Project Professionals](https://www.projectcontrolacademy.com/wp-content/uploads/2024/08/4-2048x1152.jpg.webp)


