
Have you ever wondered how you could apply Earned Value Management in the Primavera P6 scheduling tool?
Wouldn’t it be nice if you can integrate your project cost with the project schedule right within your scheduling software?
Primavera P6 enables you to control project progress and performance using Earned Value Management technique.
In this tutorial, I will show you how to use Earned Value Management in Primavera P6.
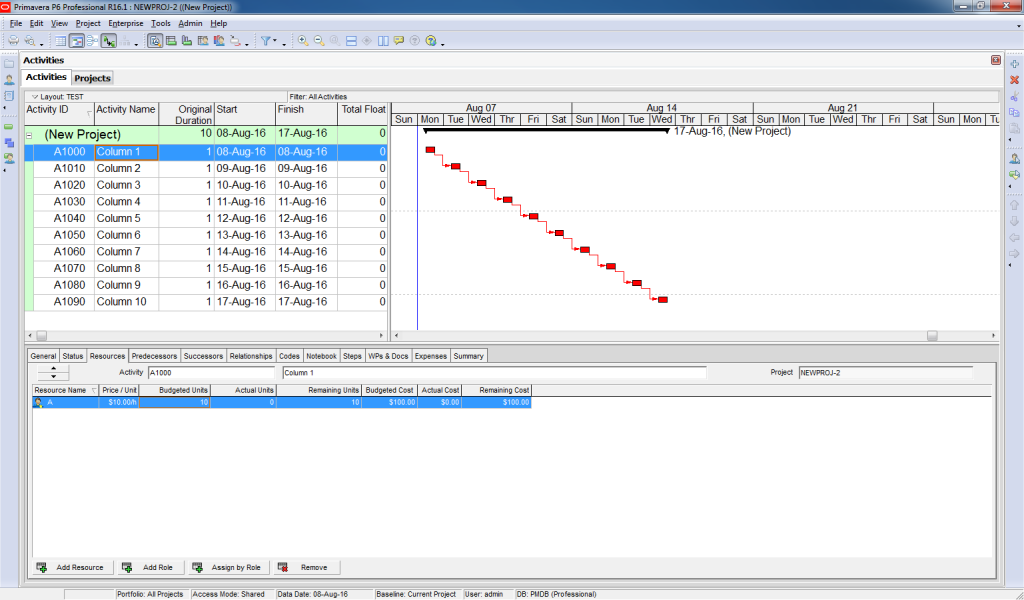
Let’s use a simple project as an example; casting of 10 columns.
- 1 column / day.
- $100 / column
Below is the project schedule. Resource A is assigned to each activity:
First, you need to create a baseline for this project.
Go to Project -> “Maintain Baselines”. Click on “Add” to assign a baseline.
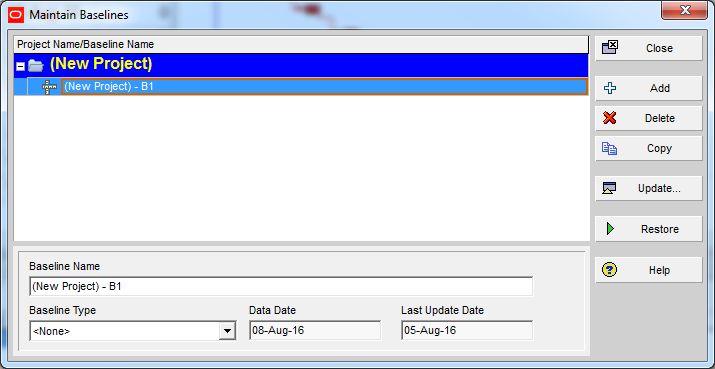
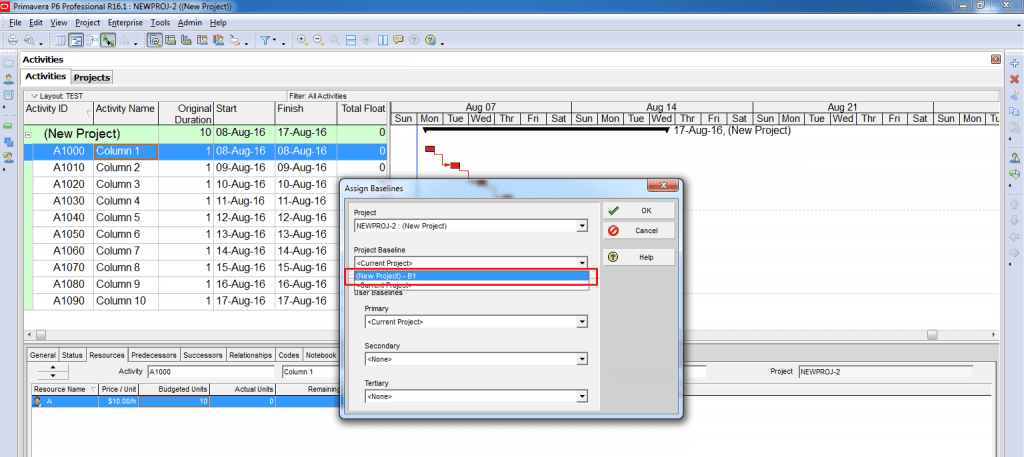
Then assign B1 baseline for your project.
To do so, go to Project -> “Assign Baselines.” Click on Project Baseline and select your baseline. Then click “OK.”
To analyze Earned Value Management, you need to add additional columns to your activity table as displayed below.
To do so, right-click on “Activity Table” -> “Column”. Then select columns in the Earned Value category.

Here is the outcome:

Now assume that it is the end of day 5 of the project:
How many columns should have been built? (The answer to this question determines the Planned Value (PV))
The plan was to cast one column per day. Therefore, at the end of day 5, five columns should have been cast.
(This value is automatically calculated by using the Baseline you assigned previously. The Baseline implies that Project’s duration is 10 days. Today is the 5th day, so 5 columns should have been completed)
Considering the cost of $100 per column, Planned Value (PV) is:
PV = 5 x $100 = $500

How many columns have actually been built? (The answer to this question determines the Earned Value (EV))
Assume that you have received a report from the construction site which stated only 3 columns are completed.
(This value is based on the actual “Performance % Complete” which is not necessarily equal to “Activity % Complete”)
EV = 3 x $100 = $300

How much did it cost to build those three columns? (The answer to this question determines the Actual Cost (AC))
You received a report from the Accounting department which stated $200/ column is spent.
(This value is based on Actual Units)
AC = 3 x $200 = $600

Now you have all the data required to analyze the EVM report. Bingo!
You can add EVM metrics such as “Schedule Variance,” “Cost Variance,” “Cost Performance Index,” “Schedule Performance Index,” “Estimate to Complete,” “Estimate at Completion,” and “Variance at Completion” as separate columns in the activity table.
Let me walk you over these metrics quickly:
Schedule Variance (SV) = EV – PV = $300 – $500 = -$200
A negative schedule variance indicates that the project is behind schedule.
1-day delay for 1 column costs $100. Therefore, -$200 SV means that we are 2 days behind.
Cost Variance (CV) = EV – AC = $300 – $600 = -$300
A negative cost variance indicates that the project is over budget.
CV of -$300 means that we are currently over budget for $300.

Assuming future work is progressing at the planned rate:
Estimate to Complete (ETC) = Budget at Completion (BAC) – Earned Value (EV)
ETC= $1000 – $300 = $700
Estimate at Completion (EAC) = ETC + AC = $700 + $600 = $1300

To have a more accurate forecast for ETC & EAC, you need to take into account the predicted project performance factor (PF). To do so, you need to change the Primavera default settings by:
Going to WBS window -> Earned Value tab.
Click on other options available in Primavera beside PF=1.
A most common forecasting method is considering the “PF = 1 / Cost Performance Index” option.
Make sure that you configure the options for calculating ETC at the beginning of the project (before running the updates).

By changing the forecasting method, here are the results:
ETC = 

( CPI = 

EAC = ETC + AC = $1400 + $600 = $2000
In addition to calculating EVM metrics, Primavera P6 also allows you to draw the related EVM graphs.
How to Draw EVM Graphs in Primavera?
To develop the graphical EVM report, first, click on the “Activity Usage Profile” button.

2- Right-click on the diagram and select the “Activity Usage Profile” Option.

3- You have various options as to how you want to display the graph. Choose the data you want to draw in the graph.

Now you have your Earned Value diagram.

I hope this tutorial provided clear instructions on how to apply Earned Value Management in Primavera.
If you have any questions, please post them down below. I will make sure that I will go through as many questions as I can and assist you in answering your questions.
Interested in having a deep-dive practical step-by-step training on EVM Implementation in Primavera P6?

About the Author, Khuong Do
 Khuong Do is a Project Planner in Civil Engineering, Transportation, and Oil & Gas Industry. He has worked as a Primavera Consultant Specialist since 2006 and willing to share his passion for Primavera through lots of Tips & Trick on his personal blog.
He holds a Civil Engineering degree and a Bachelor of Information Management System. Now he is working in Petronas RAPID project, one of the biggest Refinery and Petrochemical complex, in Pengerang – Malaysia


![[Free 90-min Masterclass] How to Avoid Project Delays Turning into Costly Claims](https://www.projectcontrolacademy.com/wp-content/uploads/2025/08/September-2025-Webcast-Chris-Carson-H01-Yellow-2048x1152.jpg.webp)
![[Free 90-min Masterclass] The Ultimate Leadership Recipe for Project Professionals](https://www.projectcontrolacademy.com/wp-content/uploads/2024/08/4-2048x1152.jpg.webp)


