Before diving into the content and providing you the Power BI starter guide, let’s have the same understanding of what Power BI is all about.
What is the Power BI?
Power BI is a business analytics service by Microsoft that puts visual analytics at your fingertips.
According to Microsoft, Power BIis a collection of software services, apps, and connectors that work together to turn your unrelated sources of data into coherent, visually immersive, and interactive insights. Your data may be an Excel spreadsheet or a collection of cloud-based and on-premises hybrid data warehouses.
Power BI lets you easily connect to your data sources, visualize and discover what’s important, create your own customized reports and interactive dashboards, and share that with your team using Power BI web services.
Power BI can be a powerful project reporting and data visualization tool for Project Controls Professionals that enables them to connect, mash-up, model, and visualize the project data from various sources. However, not everyone knows how to tap into the Power BI and get started in Power BI.
How to Get Started in Power BI?
Starting out in Power BI can be difficult.
I remember it took me a few weeks to really dive into it and learn some of the basics.
I was getting pretty good with Excel and kept running into problems with Pivot Tables. I knew there had to be another way to analyze data – a faster and more organized way to answer questions from my managers.
This is when I started looking for answers online and came across Power BI.
Fast forward about 3 years later, I am now helping many of my friends learn about Power BI.
To get started in Power BI, following the 10 steps below would be a good starting point.
But…. if you are more interested in having a step-by-step guide, proven and practical tools & techniques, and a tailored hands-on approach to the application of Power BI in Project Controls, without spinning your wheels with half a dozen random tactics, you may consider the hands-on online training organized by Project Control Academy; Power BI Visual Data Analytics for Project Controls.
10 Tips to Get Started in Power Bi- The Power BI Starter Guide
I’ve put together 10 tips that helped me get started in Power BI. If you are beginning your journey in Power BI, I believe following these 10 easy steps would be a great starting point.
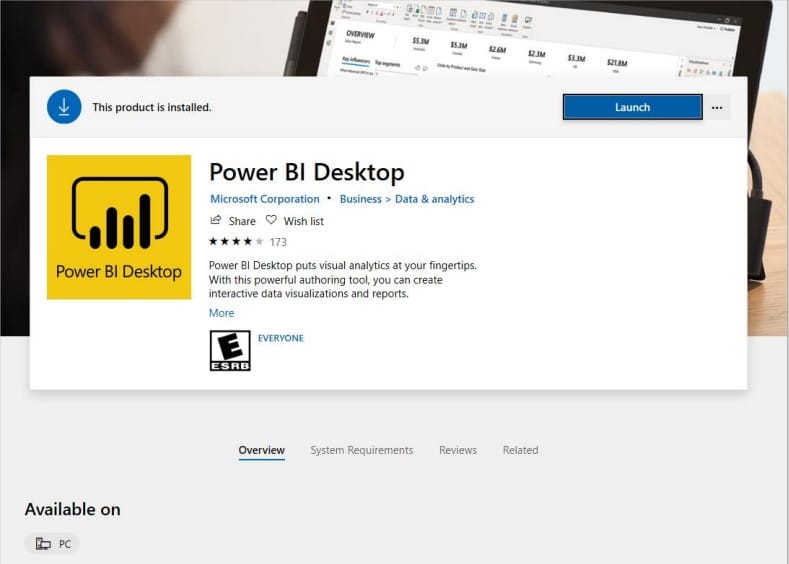
1. Download Power BI from the Microsoft Store
The first step is downloading the Power BI, so you can experiment with it. To get the Power BI Desktop, go to Microsoft App Storeand download it for free.
Power BI auto-updates when downloaded from the Microsoft Store. Anytime the Power BI team updates the software (monthly updates), you will automatically get the latest version of Power BI.
Go ahead and download Power BI now before moving on to the next step.
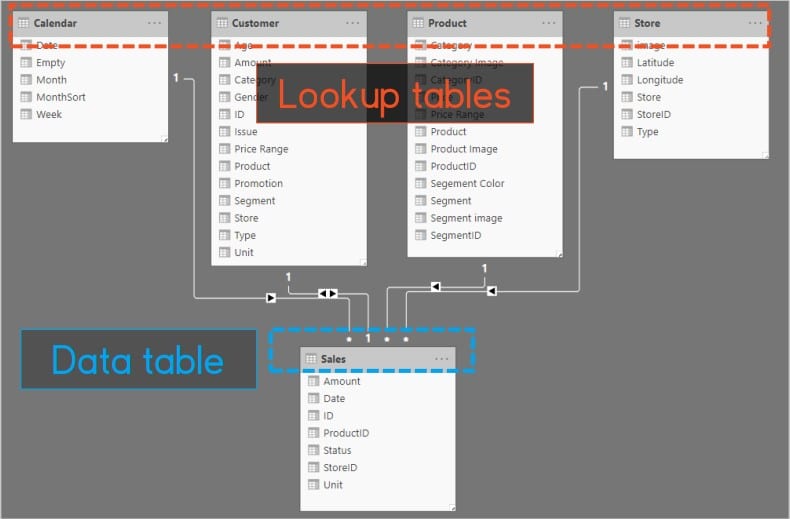
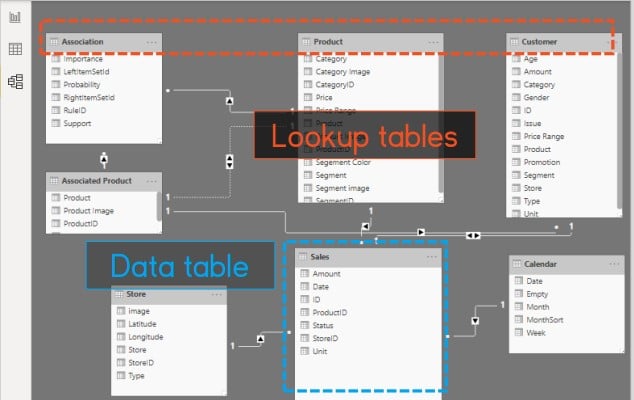
2. Learn about Lookup Tables vs. Data Tables
To get started in Power BI, make sure that you learn about the Lookup Tables vs. Data Tables.
Lookup Tables (formally known as Dimensions) are attributes (dimensions) that you model and want to slice/group data by. For example, location, people, products, time
Data Tables (formally known as Facts) store observations or events (facts). Examples are sales transactions, temperatures, stock prices, manufacturing production
To get more information, please read the following resources:
Now it’s time to get into action and grab the data you want to analyze.
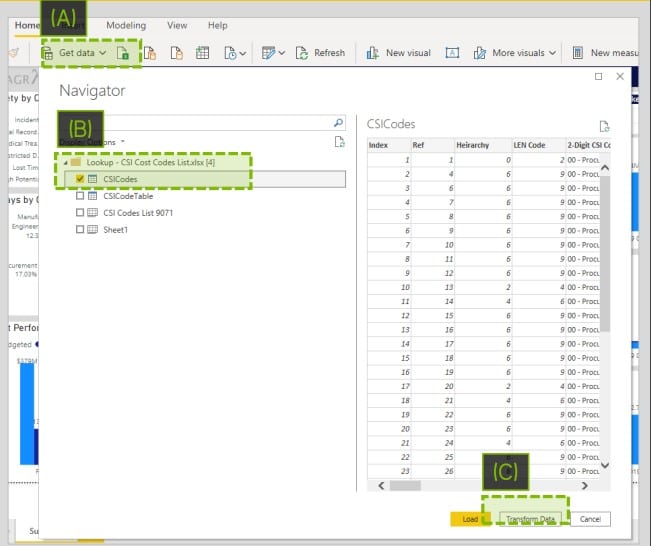
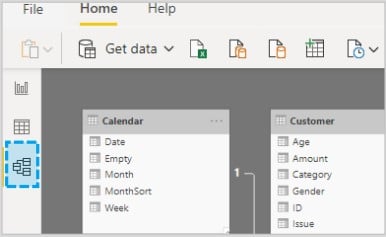
Power BI Desktop connects to many types of data sources, including local databases, worksheets, and data on cloud services. You can get data from any of the data sources in Power BI by selecting “Get Data”.
(A) – Get Data is where you can connect to data sources like Excel
(B) – The navigator windows show a preview of the data sources
(C) – I always click “Transform Data” to go to the Query Editor.
Check this tutorial to get more information on how you can connect to data sources and import data into Power BI.
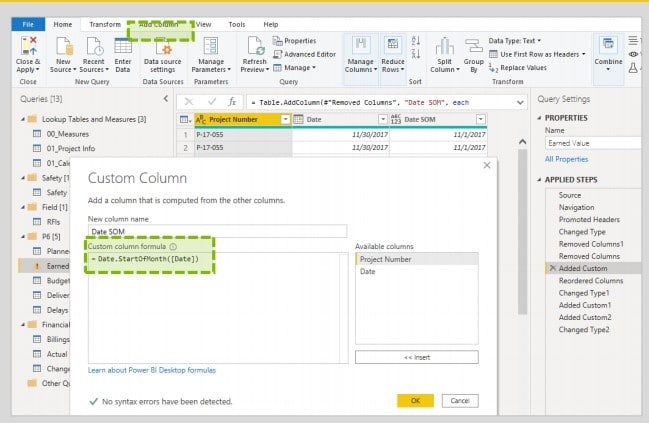
4. Transform Data with Power Query ( M Language)
Sometimes when you gather data, it’s not quite as structured, or clean, as you want it to be.
To structure data, you can transform it, meaning that you can split and rename columns, change data types, and create relationships between columns.
Cleaning and prepping data is where the majority of your time is spent (estimated at 70-80% of your time). You can clean up and transform data using the Query Editor (aka Power Query)
In the above screenshot, I added a custom column because I wanted to have dates at the beginning of the month instead of the end of the month.
Power Query (M code language) is the area I always want to learn more about and practice since so much time is spent cleaning data. My go-to Power Query resource is PowerQuery.io, the site that contains Power Query functions. Check it out.
5. Create Relationships Between Tables
The next step is creating a relationship between tables. To do so, never do a VLOOKUP again! Power BI lets you create relationships between tables.
For example, you can relate a Product list (Lookup table) to a list of Sales transactions (Data table) using a one-to-many relationship. Creating this relationship will allow you to calculate and analyze total sales by product. The old way in Excel would have been combining the product and sales table using a VLOOKUP or INDEX/MATCH.
To get more information on creating relationships between the tables, check the Microsoft guide.
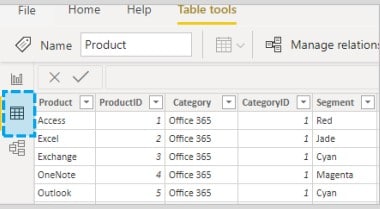
6. Switch Between 3 Views (Report, Data, Model)
When working in Power BI desktop, there are three views that you can switch to: “Report view”, “Data view”, and “Relationships view”. Let’s explore each one:
Report View:
Power BI Desktop includes a Report view, where you can create any number of report pages with visualizations. It’s the default canvas area to visualize data.
You can copy, paste, move visualizations/charts around, merge, and so on.
Data View:
The data view looks like a table from Excel. This is what the data looks like after it has been loaded to your model. Data view helps you inspect, explore, and understand data in your Power BI Desktop model.
Model View:
The model viewshows all of the tables, columns, and relationships in your model. You can create, manage, and view relationships among tables. This view can be especially helpful when your model has complex relationships between many tables.
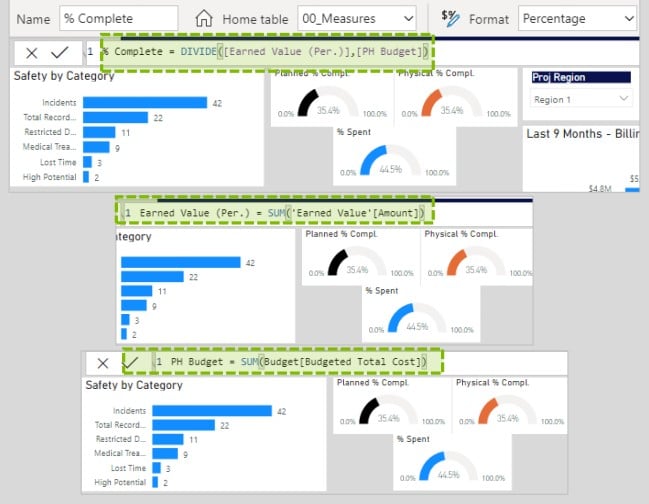
7. Make A Measure To Aggregate Data (DAX)
Power BI Desktop helps you create insights into your data with just a few clicks. But sometimes that data just doesn’t include everything you need to answer some of your most important questions. Measures can help you get there.
Measures are used to aggregate data in some of the most common data analysis. Simple measures used for summarizations are sums, averages, minimum, maximum, and counts.
The powerful piece is that measures will change based on filters applied in your report (slicers). For example, a % Complete measure will change if a different project name is selected, or a specific region is selected.
8. Make A Chart With Your Data (Visualization Pane)
Now it’s time for the fun stuff!
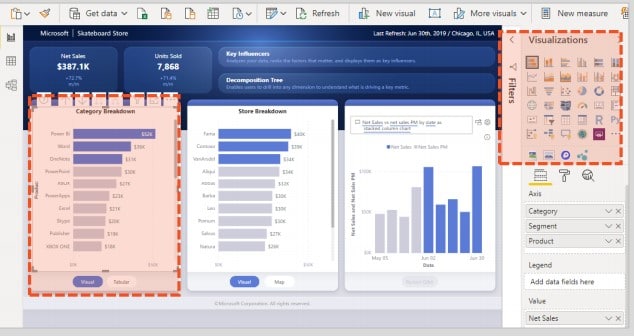
Once the data is cleaned and measures are written, you can now visualize your data and make beautiful reports.
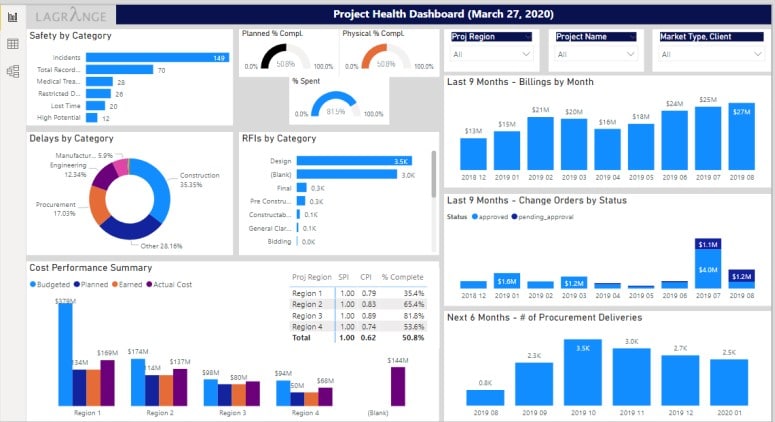
In the screenshot above, the stacked bar chart is displaying net sales by product. Power BI, Word, and OneDrive are the top 3 products sold.
The visualizations pane has a wide variety to choose from:
Bar charts, column charts, clustered bar/column charts
Line charts, area charts, line & stacked column combo
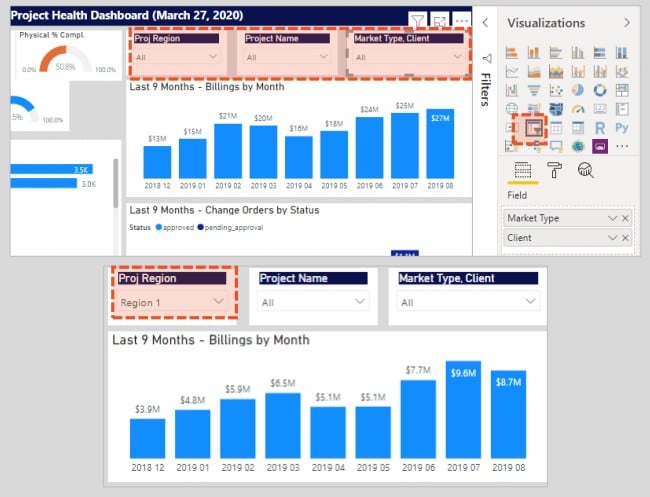
Slicers in Power BI act as filters for your data/reports. Instead of creating multiple tables to display billings by project, a slicer can be used to change all visuals in your report.
Lookup tables (attributes) are perfect to use as slicers. For example 1) Project names, 2) Date ranges, 3) Customer, 4) Location.
10. Practice, Practice, P R A C T I C E!
Still reading? Well, isn’t it time to put your knowledge to the test by getting into action and practicing what you’ve learned in this blog post?
Practice cleaning/transforming data (Power Query).
Practice modeling and visualizing data (DAX measures).
Start with a spreadsheet that is used throughout your team/company and try to standardize/automate a common business process. You’ll already be familiar with the data/process and can quickly improve it in Power BI.
Practice Power BI every day and you’ll soon be a data wizard!
Now, are you ready to get your hand dirty and get started in Power BI?
About the Author, JC Vanbrunt
JC VanBrunt is a Director at Lagrange, a management consulting firm providing project controls and program management services.
JC is responsible for providing data integration and developing reporting capabilities for clients.
Prior to Lagrange, JC was at FTI Consulting as an analyst in the Construction Solutions practice where he worked on construction cost claims and preparing expert witness reports for arbitration and litigation.
JC graduated from the University of Washington with a Business Administration degree focused on Finance and Accounting.
AI is moving fast, but many project controls teams are still stuck with scattered files, manual reports, reactive reviews, and delayed insights. This article shows six practical AI shifts that can help you save time, improve analysis, and build the skills needed to stay ahead.
Learn the difference between delay analysis and forensic schedule analysis, and why schedulers, planners, and project controls professionals must prove causation, critical path impact, and delay entitlement.
Are you considering attending a Project Controls conference in 2025? Whether you’re looking to sharpen your skills, discover the latest industry trends, or connect with like-minded professionals, conferences are one of the best ways to elevate your career. Every time I attend a conference, I’m reminded of how energizing and
InEight and Project Control Academy have joined forces in a strategic partnership aimed at advancing and standardizing technology implementation best practices in the field of project controls.
Discover how to excel in your project career by mastering the secrets of effective leadership. Learn how communication, influence, and emotional intelligence can fast-track your success.


![[Free 90-min Masterclass] How to Avoid Project Delays Turning into Costly Claims](https://www.projectcontrolacademy.com/wp-content/uploads/2025/08/September-2025-Webcast-Chris-Carson-H01-Yellow-2048x1152.jpg.webp)
![[Free 90-min Masterclass] The Ultimate Leadership Recipe for Project Professionals](https://www.projectcontrolacademy.com/wp-content/uploads/2024/08/4-2048x1152.jpg.webp)


