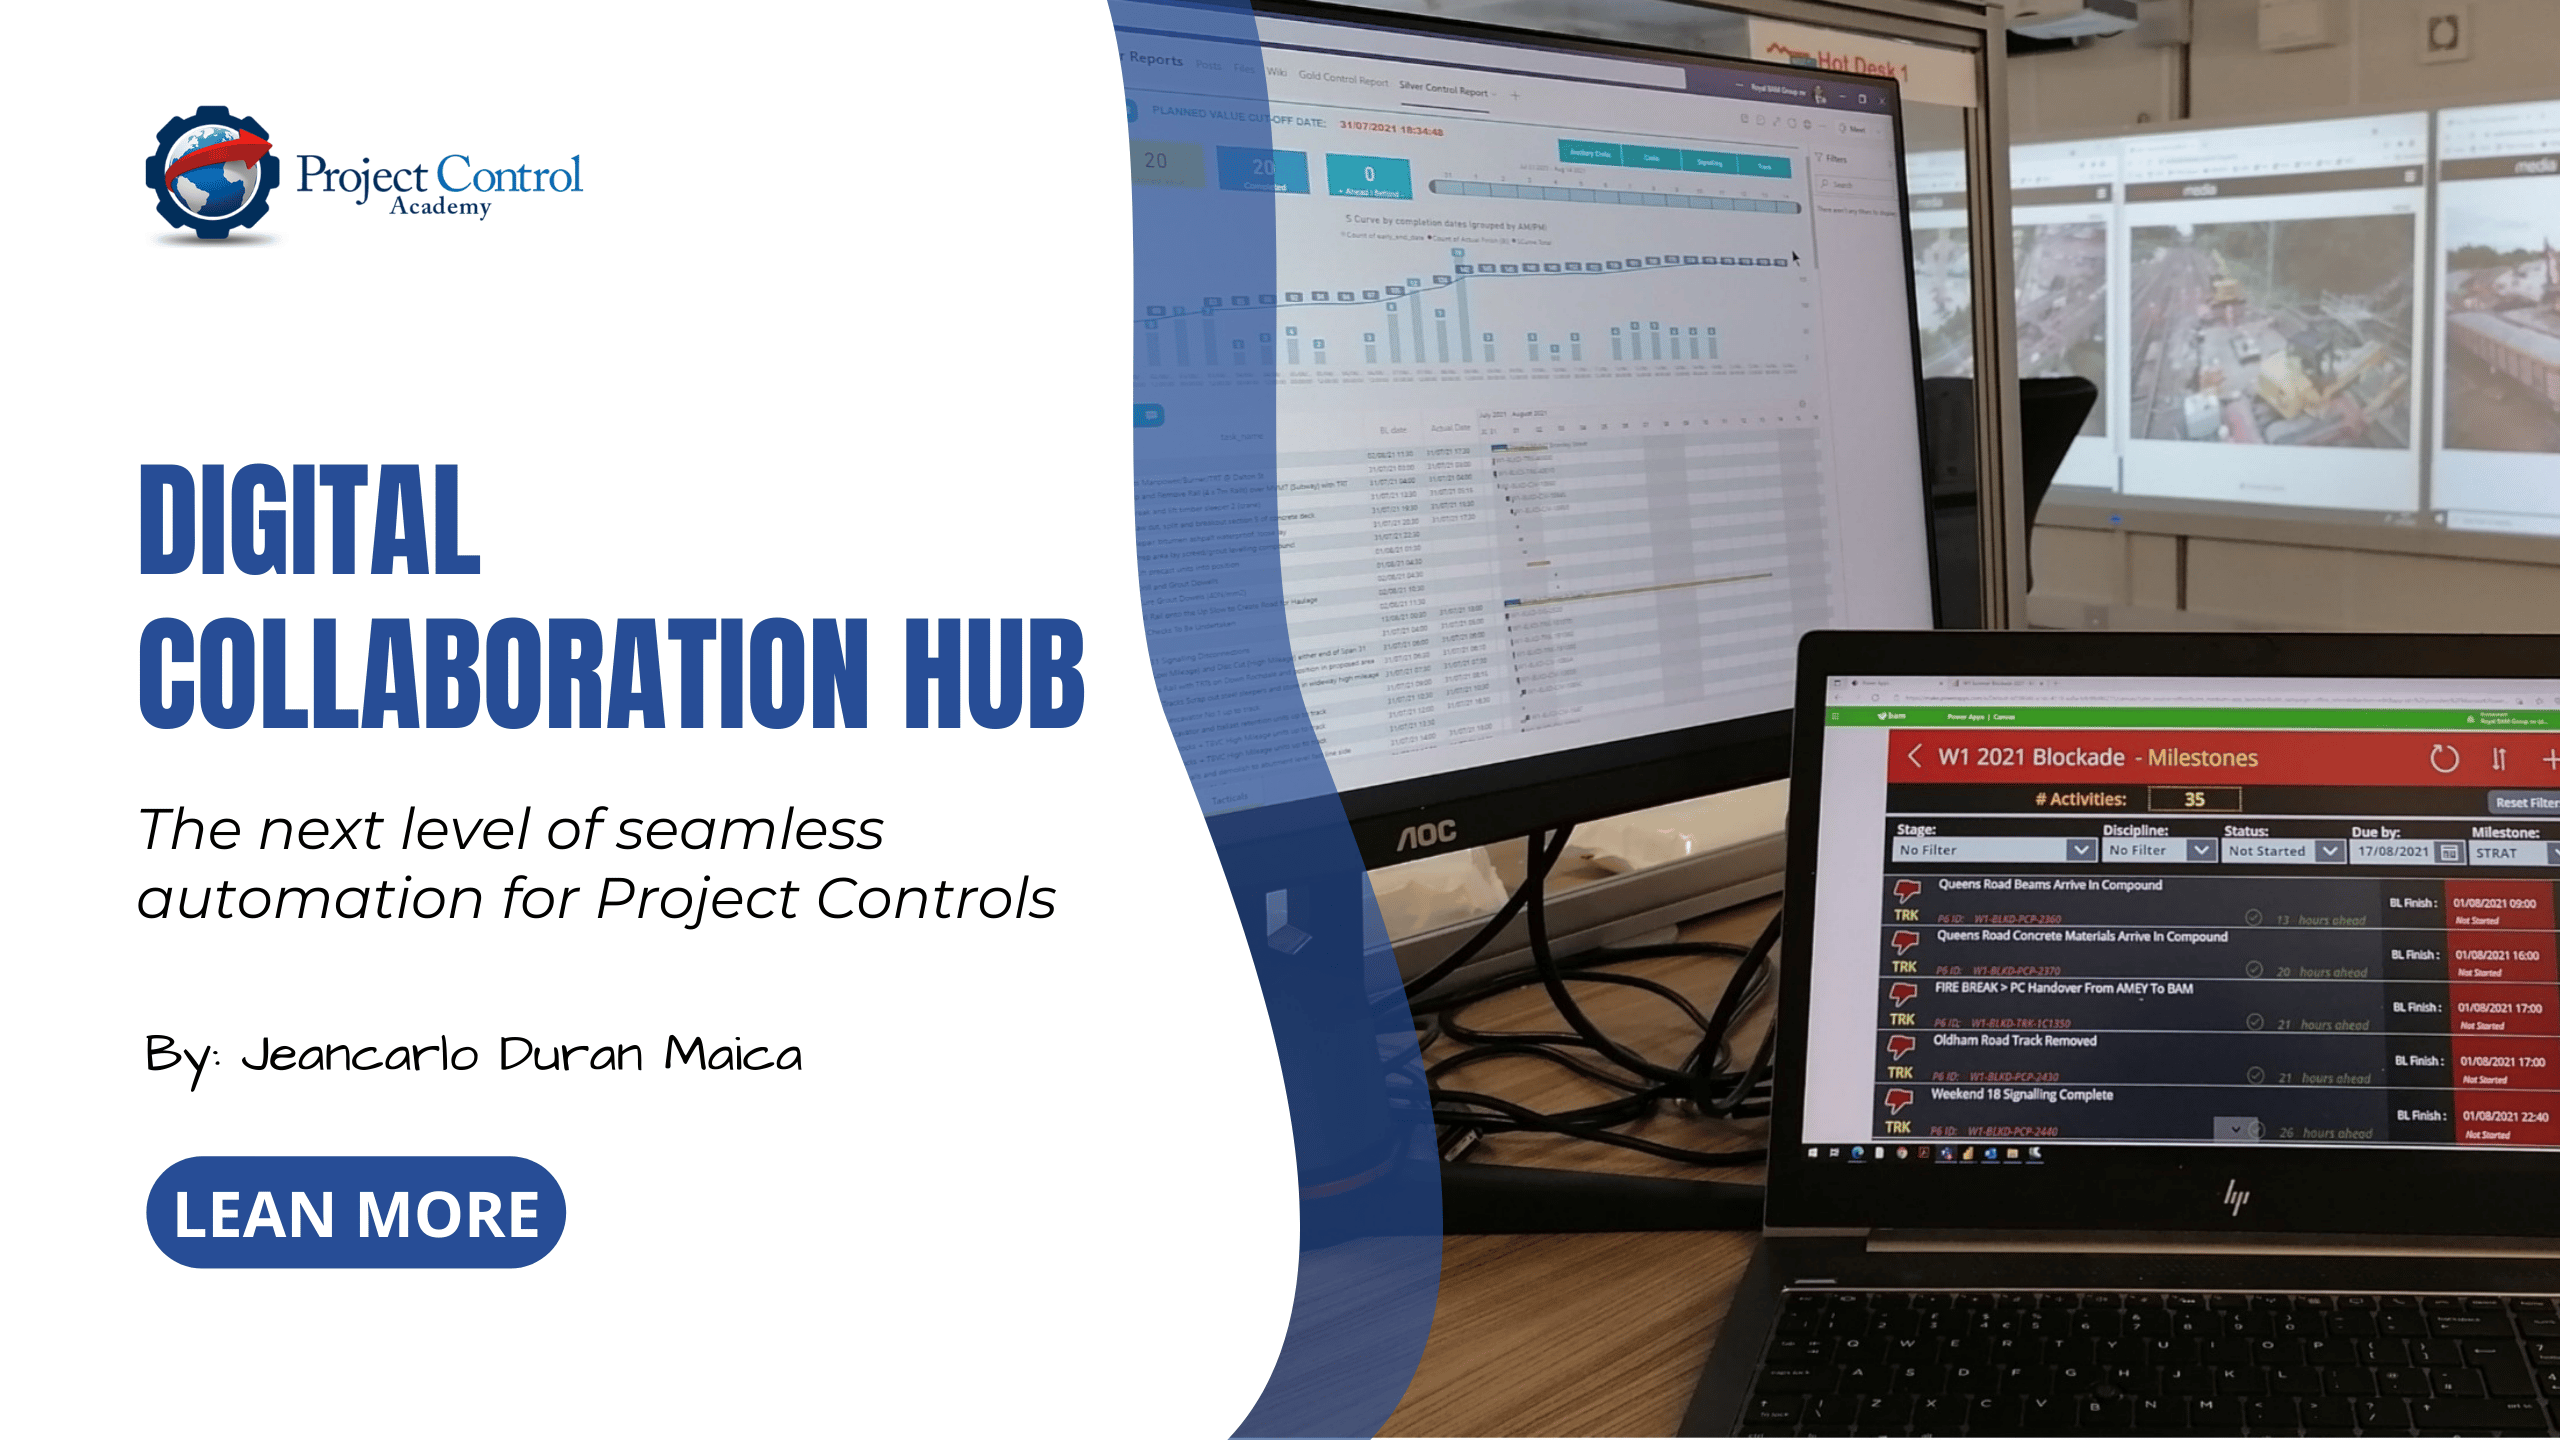
Digital Collaboration Hub is the next level of seamless automation for project controls and the future of construction projects.
But what is a digital collaboration hub and how you can adopt one in your projects?
Have you ever watched one of those high-stakes spy movies, you know, where the protagonist is on the ground?
Almost always, the protagonist knows exactly where to go. Usually, someone named Q is guiding their movements while sitting in a state-of-the-art collaboration hub surrounded by surveillance screens.
Well, guess what? You can create that atmosphere in your construction workplace, minus the intrigue.
In this blog post, you will learn how to drive the creation of a Digital Collaboration Hub in your construction project. The best part? The tools that you need are most likely already within your reach!
Some of you might say, “Tools schtools! What about People and Processes?”
Well, we emphatically agree. This is why the author’s journey of creating a Digital Collaboration Hub serves as the inspiration for this blog post, where he shares his groundbreaking experience in TRU Alliance.
The TRU Alliance has identified a need to shift the business towards the use of digital construction, near real-time reporting and improved collaboration through the support of digital control rooms.
Following 16 days of railway blockade works to renew structures (as seen in Fig. 1 below), the TRU West Alliance successfully handed back the railway line between Manchester and Stalybridge.
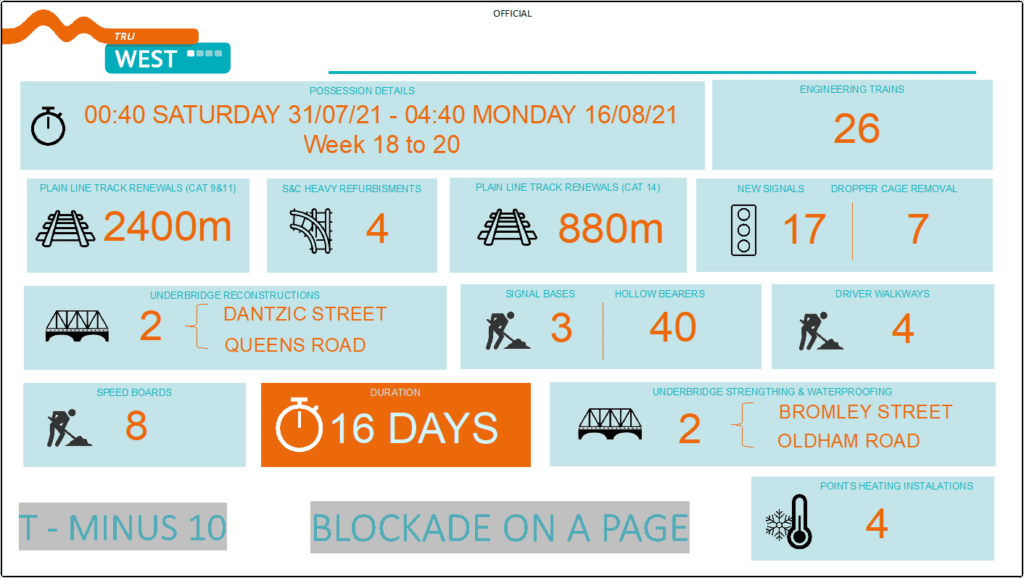
Figure 1: The Possession/Blockade Sub-Project Utilizing the Digital Construction Hub
The Digital Collaboration Hub played a major role in fostering and facilitating this collaboration and in providing real-time communication to the delivery team. Although it has now become the new standard for project controls reporting within the TRU Alliance, this new way of working has provided the business with the ability to make informed decisions in a timely and concise manner.
In this 16-day period, the team delivered over 100 automated Power BI reports to stakeholders, capturing real-time data using Power Apps. Although the single source of truth was available live 24×7 embedded in MS Teams, a status freeze (every 4 hours) was part of the project’s reporting requirements.
1 Rationalizing The Need For A Digital Collaboration Hub
It is well documented that the Construction sector is one of the least digitized industries. Modern rail construction projects are complex being multi-disciplined with geographically dispersed teams needing to work together.
The size and breadth of the TransPennine Route Upgrade project (TRU) both in terms of people and logistical size, has identified a need to progress the organization towards the use of digital solutions. This shift has become even more important given the current working conditions in the United Kingdom and the need for social distancing in the future.
Nonetheless, innovation is not just the introduction of new technology, it is a fundamental shift in the business processes and workflows. The successful implementation of any innovation within a business is largely due to implementing the required changes in business processes and engaging the people that are to drive these processes through.
Ultimately, technology is the smallest part of the chain in implementing innovation. TRU has made great headways to set the standard on digitization and becoming an industry-leading project through the implementation of an innovative digital collaboration hub (control room).
2 The Pain: Traditional Reporting Cycle
Part of the problem is that we embrace the problem. Within an engineering environment, Microsoft Excel is king.
The project lifecycle is typically handled by different, independent systems that do not share information to one another. Aligning data between multiple source systems is so manually intensive that the only feasible solution is to manually extract data from these isolated systems and compile the necessary information in Excel. Then, it’s too difficult to reproduce these reports in the same way each time so the same reports month-over-month may not show comparable information.
Just have a look at Fig. 2 below, we have the well-respected process map for performance measurement (Lance Stephenson, Figure 9.2-1) but overlaid with the go-to tool used to implement the process map.
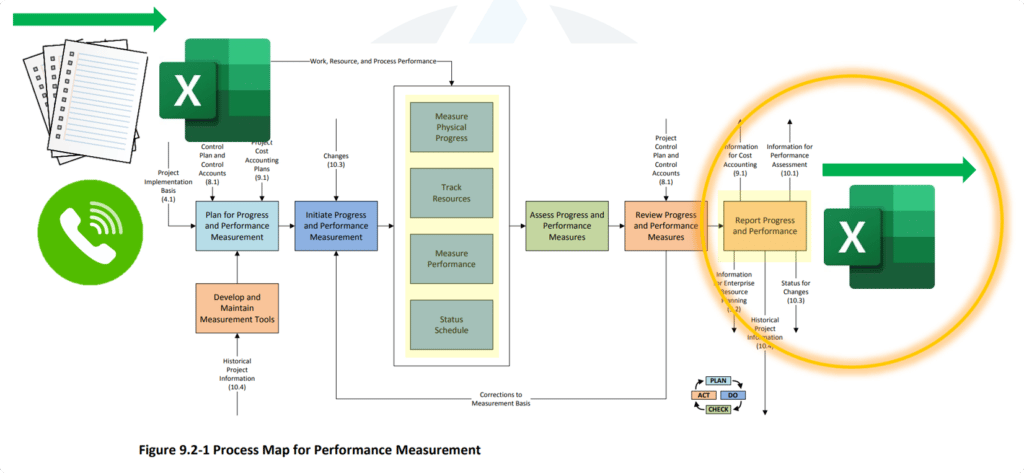
Figure 2: Excel – The Default Tool for Performance Measurement
As you can see, project controls is unfortunately ruled by Excel.
Multiple spreadsheets are created to develop estimates and track budgets and forecasts. We manually extract data from Planning software and copy/paste into excel to share lookaheads with our project team. Does Fig. 3 below look familiar to you?
The status quo in the engineering and construction industry is to manage several spreadsheets to determine the project’s performance.
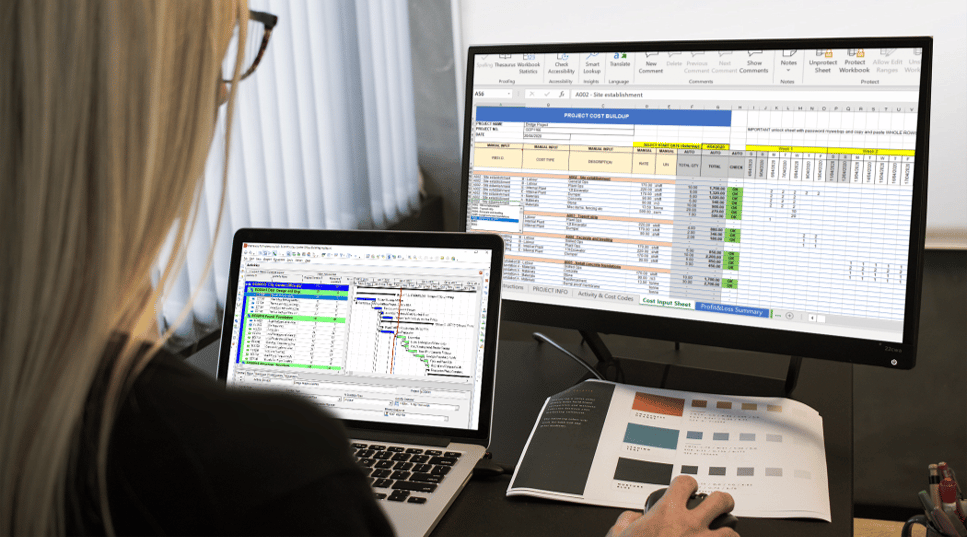
Figure 3: Creating the Schedule in a Scheduling Software Only To Then Share An Excel Equivalent
In this context, it is very difficult to track changes; incorrect formulas become buried in the maze of spreadsheets; summary spreadsheets provide no access to the data that informs the numbers. The reality of this process is a lot of painful, manual number crunching to simply generate reports, leaving little time to actually perform analysis and improve performance.
3 The Pragmatic Approach To A Digital Collaboration Hub
Due to the number of reasons identified in the traditional reporting cycle, the TRU Alliance decided to streamline the reporting process and fight back the lack of standardization that has governed our industry.
The aim is to use the power of technology to automate data collection (and reporting) and focus on forward-looking activities to improve project collaboration and predictability.
Forward-looking activities are driven by past project data and help improve the project predictability by providing more accurate planning, estimates and forecasts. These are referred to as value-added activities and tend to have the greatest impact on project performance.
We stated before that the successful implementation of any innovation relies on business processes and the people that are to drive these processes through.
TRUWest followed this approach and focused on processes and people to allow the organization to overcome all the conventional reporting cycle constraints. It consisted of:
- Reduce the numbers: Reduce the opportunity for miscommunication by limiting the number of people involved in the process
- Standardization: Information collected in the same way, in the same format, every time, no spreadsheets
- Single source of truth: one set of data, in one place, with the same message
- Automation: Exploiting digital tools to seamlessly automate the reporting to the respective stakeholder, same quality, every time.
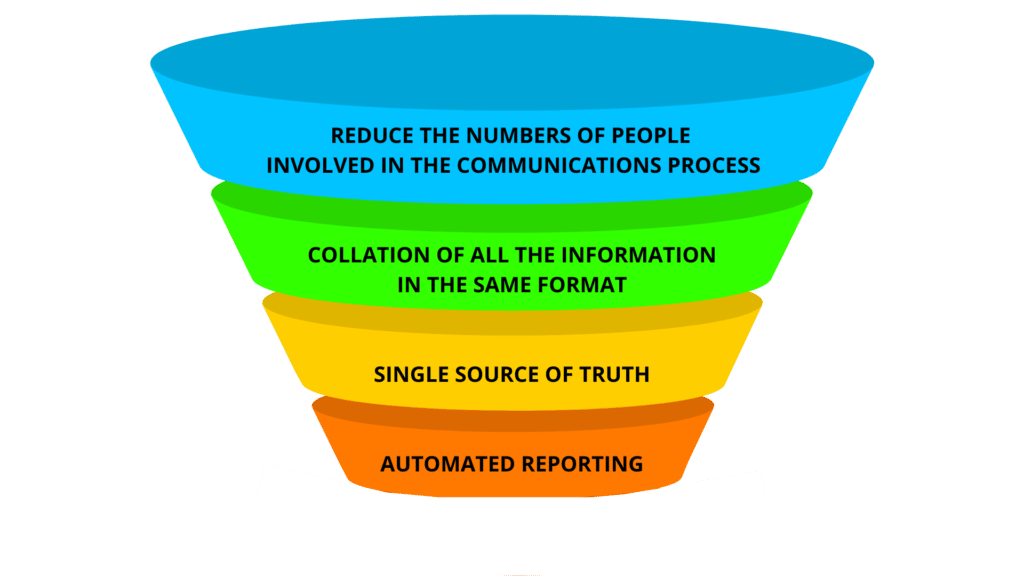
Figure 4: Driving the Digital Approach By Focusing on People and Processes
An essential foundation for this project was to fully understand the requirements. This is often an area that is given insufficient attention and ultimately leads to the failure to deliver a functional product.
With the introduction of innovation or technology, it is easy to allow requirements and specifications to run out of control without due consideration of what the end product ultimately needs to deliver for the business.
With that in mind, the team agreed to implement a Digital Collaboration Hub, a combination of hardware + software (see Fig. 5 below) that will allow the project team to:
- See The Current Situation At A Glance
- Expose The Key Issues Across The Project
- Drive The Right Actions That Improve Project Performance
- Measure Effectiveness
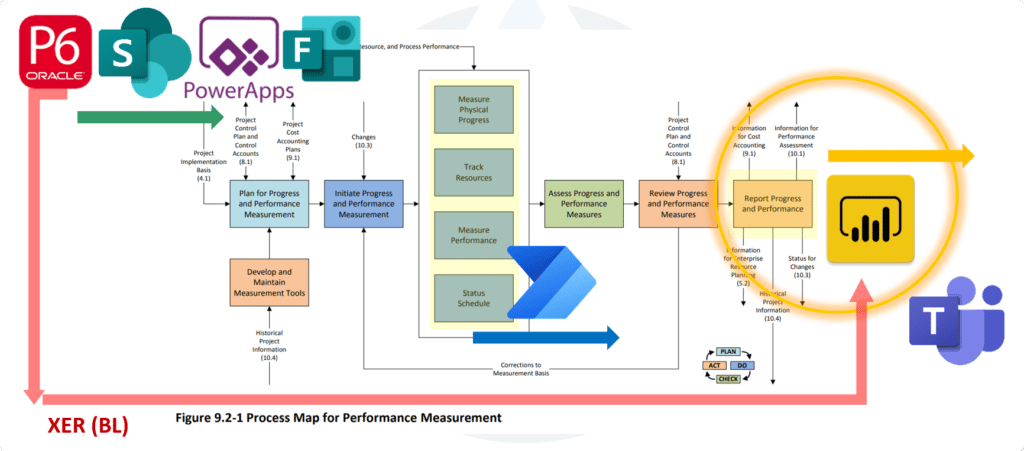
Figure 5: Moving Away From Excel – The Software Tools Now Used For Performance Measurement
4 The Outcome – Assembling the Digital Collaboration Hub
4.1 Innovative Hardware Used Within The Digital Collaboration Hub
To improve collaboration, communication and reporting, the TRUWest implemented an innovative Control Room with six full-wall touchscreens and a meeting room for the W1 Project Summer Blockade 2021. Additionally, a 270◦ BIM Cave was installed as a virtual space for design reviews and other virtual site visit use cases. Fig. 6 below shows the surveillance room – I mean – collaboration hub in action.
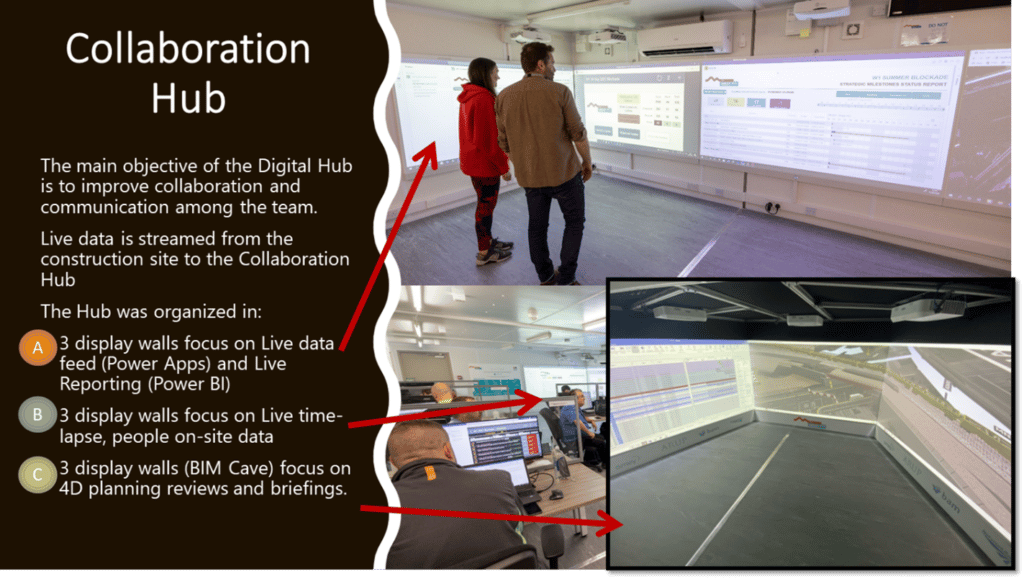
Figure 6: The Heart of the Digital Collaboration Hub – Utilizing Hardware To Maximize Visualization
The main objective of the Collaboration Hub is to improve collaboration, communication and coordination. This is achieved by bringing to life large volumes of data together and making it accessible to all through technology.
Live data are streamed from the construction site to the Collaboration Hub, via various digital solutions, such as data capturing tools, smart progress tracking apps, HoloLens and 360◦ cameras, all hosted in the Microsoft Teams Environment. Utilizing Microsoft Teams allowed people to access the data remotely from their laptops, phones and tablets – with a very similar experience as in the physical Collaboration Hub facilities.
Collaborative working through the Collaboration Hub aimed to reduce the fragmentation of communication between stakeholders and the ‘silo culture’.
The planning of multidisciplinary work was streamlined as logistics and interactions are efficiently managed. Opportunities to improve efficiency, performance and timelines were maximized with direct access to live data.
Project teams had the ability to assign and coordinate work between contractors. Then, by monitoring progress against the planned schedule, they could address issues that arose regarding the flow of resources and labour productivity, checking that completed work meets required quality standards and ensuring that work is carried out safely and efficiently as possible.
In addition to the physical facilities and access to hardware, the implementation of an integrated project controls system and processes for reporting was crucial for the automation of data collection and visualization.
The project team used the Microsoft Power Platform, a low-code business application that enables project teams to create and deploy tailored apps, reports and workflows. The complete suite of software included:
- Primavera P6: For planning hour-by-hour schedules (Baseline)
- Power Apps: Drive data collection process from site (Actuals)
- Power BI: Business Intelligence tool to analyze the data exhaust from Apps
- Power Automate: To automate workflows and trigger data refreshing
- Microsoft Teams: To embed Power BI reports and work as a single source of truth
- Microsoft Sharepoint: To work as data repository for the business apps.
- Microsoft Forms: To capture live data commentary to add on reports
This complete suite of tools enabled the team to automate data loads from external systems and prevent errors associated with manual data entry and consolidation.
This suite of tools then synergizes with hardware and that drives the digital collaboration hub. We can see the integrated solution in action in Fig. 7 below:
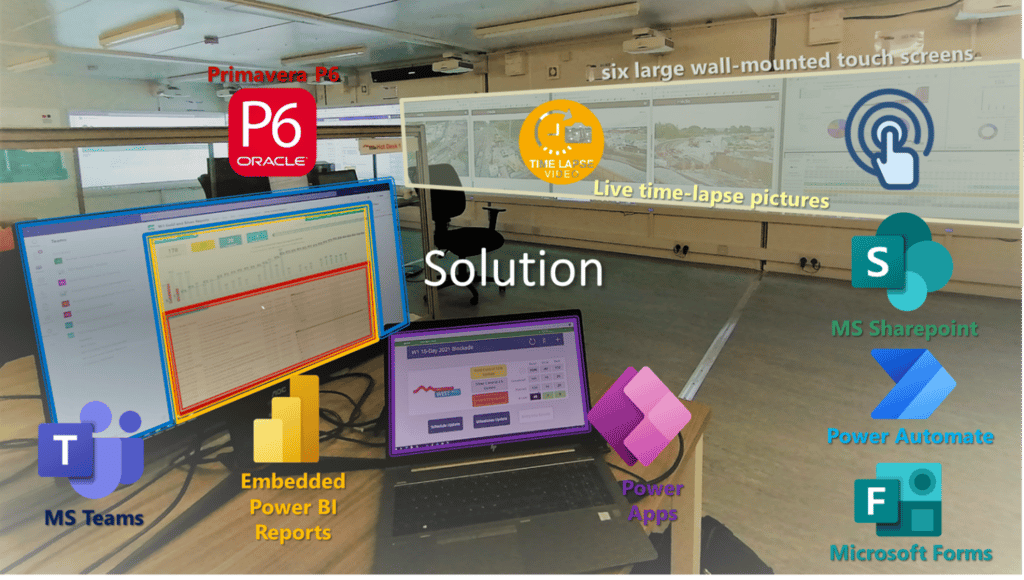
Figure 7: Combining Software and Hardware Innovations To Drive The Digital Collaboration Hub
4.2 The Power App – Enabler For The Digital Collaboration Hub
The business app was customized and tailored for the specific project needs (railway blockade). It allowed people on site not only to collect valuable data but also to raise alerts about activities that were due to take place in the course of the current and next shift.
As shown in Fig. 8 below, the app showed on demand the list of activities sorted by due date and automatically identified the number of hours the activities were ahead/delayed against the planned dates.
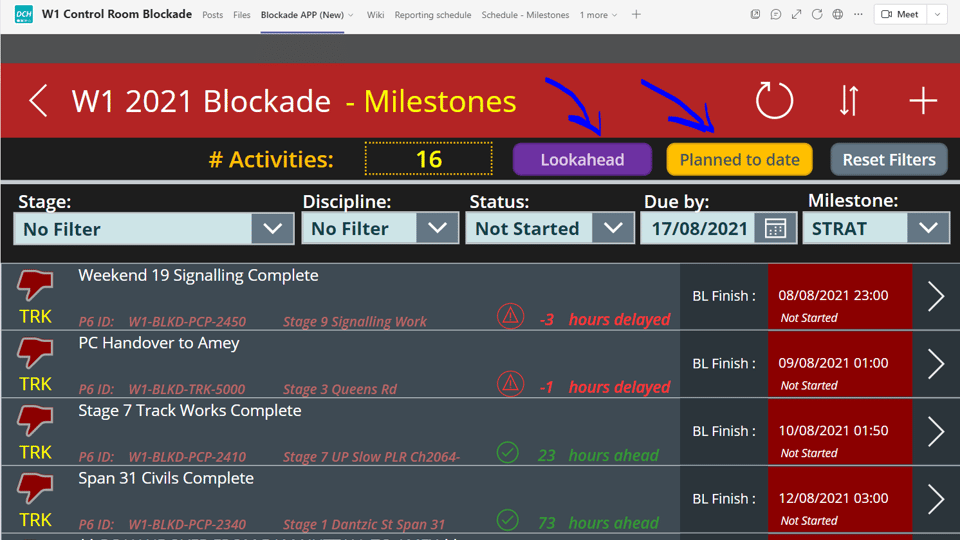
Figure 8: The Power App Allows List of Activities To Be Seen On Demand
In addition, the application offered different filters and displays to help users quickly identify their activities. One of the favorites was the lookback/lookahead screen (Fig. 9 below). It displayed complete, ongoing or un-started activities with a color code for the past / next 12 hours.
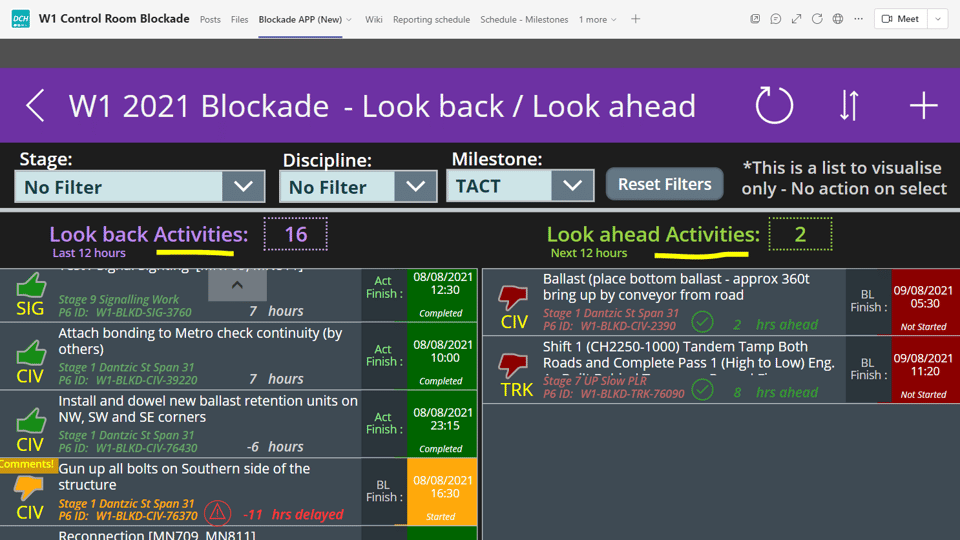
Figure 9: The Power App Filter Can Show Lookback / Lookahead Activities
4.3 The Power Automate Workflow – Enabler For The Digital Collaboration Hub
TRU West planning team developed an hour-by-hour detailed plan for the railway blockade using Primavera P6. The baseline schedule consisted of more than 1,500 activities that were uploaded into Power Apps via SharePoint List. So what would happen if the plan needs to be re-baselined? How would we update the information in the App?
In theory, we would have to manually update the 1,500 dates in our SharePoint list to feed the App. Rather than working around this manual process, TRU West opted to use Power Automate to build an automated workflow using prebuilt templates and tailored automations.
Low-code automation is a new approach to automating business tasks, processes and system workflows. Power Automate helps your people shift away from tedious manual tasks to more strategic work. In this scenario, the team set the workflow using Power Automate (Fig. 10 below) in the following manner:
- Export the 1,500 activities (re-baseline) using the P6 spreadsheet template
- Store the spreadsheet on OneDrive/SharePoint
- Use Power Automate to set a recurrence (daily) and trigger the workflow
- Power Automate will compare Ids on the Spreadsheet against Ids on the SharePoint list
- If condition is met (equal Ids) then Power Automate will update the SharePoint list details
- If not (new activities) Power Automate will create a new item on the SharePoint List
- The SharePoint List will then inform the Power App and refresh the 1,500+ planned dates
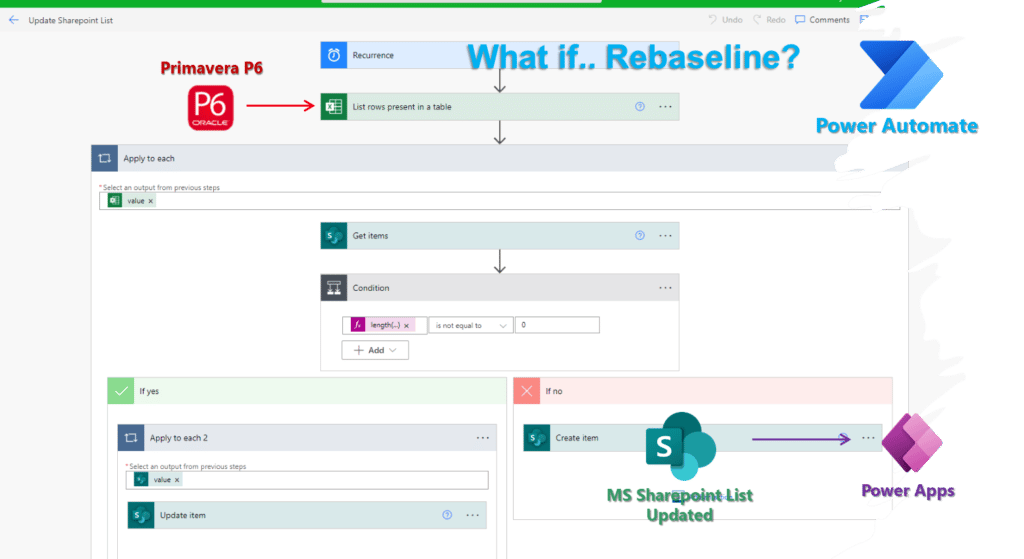
Figure 10: An Example of How Power Automate App Handles A Schedule Re-baseline
4.4 The Automated BI Report – Enabler For The Digital Collaboration Hub
TRUWest used Power BI for report automation. Not a single spreadsheet was involved in the process. The workflow involved capturing the baseline data directly from Primavera P6 XER files, actual data directly from the Power App (through SharePoint List as data repository), and discipline leads commentary from Microsoft Forms. Power BI will serve as the data integrator and provide standard reports structured in the same way and same format every time. Fig. 11 below shows an example of such an integration.
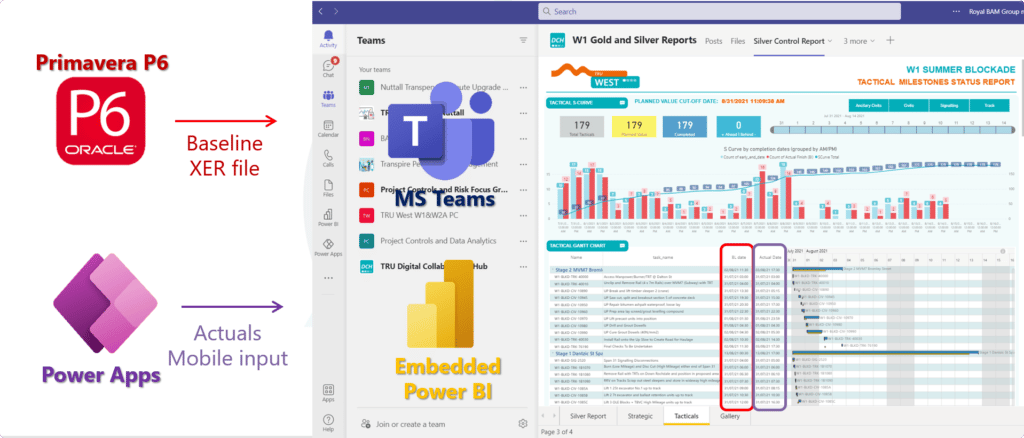
Figure 11: Progress Reports Automated Using Power BI and Embedded in MS Teams
The team used MS Teams to embed the Power BI reports and provide a single source of truth to all the stakeholders by allocating the information in one place, with the same structure every time. These reports were refreshed every 30 mins and PDF every 4 hours.
4.5 Measuring The Success Of The Digital Collaboration Hub
The delivery of the 16-day Railway blockade was a success for the Alliance. As a result of this implementation, the Alliance was able to deliver the following metrics in Fig. 12 below:
- 78% activities completed ahead of plan
- 90% completed within a 3h difference to planned dates
- 0 accidents and over 600+ close calls captured in a lively manner
- 130+ automated Power BI reports delivered over 16 days (~ 8 reports daily)
- 98% BI Reports delivered on time (2% within 5 min delay due to software glitches)
- All blockade works complete 3hrs ahead of planned hand-back to train operators

Figure 12: Key Accomplishments Driven By The Digital Collaboration Hub
5 Concluding The Digital Collaboration Hub Journey
TRU West Alliance leveraged the use of technology (hardware + software) to automate day-to-day processes (data collection and reporting) and focus on forward-looking activities to improve project collaboration and predictability. The collaboration hub proved to be a catalyst for fostering communication and providing real-time data along with the following benefits:
- Automate your entire reporting cycle and tremendously reduce the amount of time in consolidating data and producing reports
- Prevent errors associated with manual data consolidation
- Provide real-time visibility into your project’s status
- Quickly identify project performance problems at the desired granularity level
- Spend more time in data analysis and flagging project issues
If you are interested in tapping into the power of Collaboration Hub and start this exciting journey in your projects, you can start by enhancing and automating your existing Project Controls reports using business intelligence tools such as Power BI.
The good news is that Project Control Academy is here to help you in this journey of mastering Power BI.
Join us in this power-packed hands-on online training workshop on Power BI Visual Data Analytics for Project Controls to get started.
We look forward to being a part of your journey to digital disruption!
References :
- Lance Stephenson, H. Total Cost Management Framework, 2nd AACE®, 2015.
About the Author:

Jeancarlo Durán Maica, MBA, MCP, CCP™, PMP®, EVP™, a Microsoft Certified Data Analyst, is a subject matter expert on Power BI and Primavera P6. His in-depth knowledge and experience in project controls best practices are widely validated with international certifications in the areas of project and cost management.
Jeancarlo has impressive capability in all planning & controls disciplines in an array of different project environments including leading large teams & project setup. He holds different professional certifications including Primavera P6 EPPM Implementation Specialist, and MCP (Microsoft Certified Data Analyst Professional).
He has been an active member of AACE International, founding the AACE Peru Section in 2013 and serving on the Board of Directors of AACE International 2017-2019 as Director-Region 10 (Latin America).
Jeancarlo is currently working as a Digital Planning and Reporting Manager for BAM Nuttall on a multi-million pound rail project in the UK (Transpennine Route Upgrade), connecting Manchester to Leeds.
He is one of the instructors of Project Control Academy, teaching the Power Bi Visual Data Analytics for Project Controls online training.
Connect with Jeancarlo on LinkedIn.

